- WEATHER
Australia
- National
- New South Wales
- Victoria
- Queensland
- Western Australia
- South Australia
- Tasmania
- ACT
- Northern Territory
Long Range Forecasts
- WARNINGS
- RADAR
- SATELLITE
- MAPS & CHARTS
- LONG RANGE
Long Range Forecasts
- CLIMATE
Climate Indicators
- NEWS
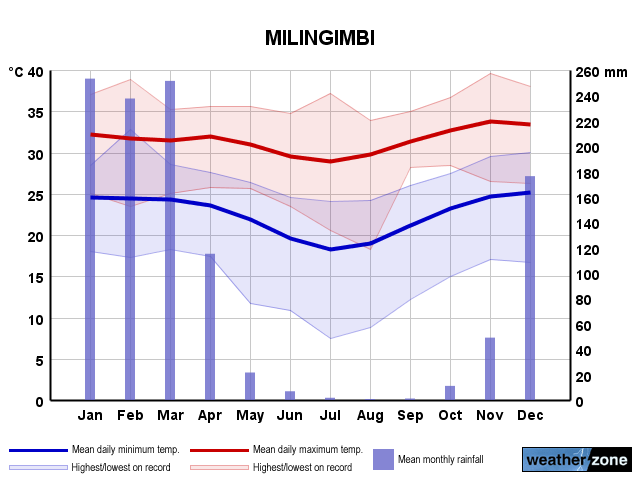
Milingimbi Long-term Averages
| Jan | Feb | Mar | Apr | May | Jun | Jul | Aug | Sep | Oct | Nov | Dec | Ann | |
|---|---|---|---|---|---|---|---|---|---|---|---|---|---|
| Mean Max (°C) |
32.2 | 31.6 | 31.6 | 31.8 | 31.0 | 29.4 | 28.9 | 29.9 | 31.3 | 32.6 | 33.6 | 33.4 | 31.4 |
| Mean Min (°C) |
24.6 | 24.3 | 24.2 | 23.5 | 22.0 | 19.6 | 18.4 | 19.1 | 21.1 | 23.2 | 24.7 | 25.1 | 22.5 |
| Mean Rain (mm) |
263.1 | 240.3 | 260.3 | 122.3 | 22.4 | 6.9 | 1.8 | 0.8 | 1.1 | 11.3 | 50.1 | 180.0 | 1130.9 |
| Median Rain (mm) |
232.9 | 215.8 | 218.3 | 55.8 | 16.3 | 0.0 | 0.0 | 0.0 | 0.0 | 2.1 | 33.1 | 137.7 | 1068.7 |
| Mean Rain Days |
15.7 | 15.8 | 16.1 | 9.3 | 3.4 | 1.0 | 0.5 | 0.3 | 0.4 | 1.3 | 4.8 | 10.3 | 73.0 |
Milingimbi Daily Records
| Jan | Feb | Mar | Apr | May | Jun | Jul | Aug | Sep | Oct | Nov | Dec | Ann | |
|---|---|---|---|---|---|---|---|---|---|---|---|---|---|
| High Max (°C) |
37.0 | 38.8 | 35.2 | 35.6 | 35.6 | 34.7 | 32.0 | 33.9 | 35.0 | 36.7 | 39.6 | 38.0 | 39.6 |
| Low Max (°C) |
25.0 | 23.5 | 25.0 | 25.7 | 25.6 | 23.5 | 24.2 | 18.3 | 28.2 | 28.4 | 26.5 | 26.1 | 18.3 |
| High Min (°C) |
28.4 | 32.8 | 28.5 | 27.6 | 27.2 | 24.5 | 24.0 | 24.2 | 26.0 | 27.4 | 29.5 | 30.0 | 32.8 |
| Low Min (°C) |
18.0 | 17.3 | 10.0 | 17.4 | 11.7 | 10.8 | 7.5 | 0.0 | 12.2 | 15.0 | 17.7 | 16.7 | 0.0 |
| High Rain (mm) |
192.0 | 167.9 | 213.9 | 264.9 | 52.8 | 74.4 | 29.6 | 21.0 | 23.9 | 68.0 | 82.0 | 146.1 | 264.9 |
Milingimbi Monthly Records
| Jan | Feb | Mar | Apr | May | Jun | Jul | Aug | Sep | Oct | Nov | Dec | Ann | |
|---|---|---|---|---|---|---|---|---|---|---|---|---|---|
| High Mn. Max (°C) |
34.1 | 33.4 | 33.4 | 33.0 | 32.7 | 31.0 | 30.6 | 31.0 | 32.5 | 33.9 | 34.9 | 35.5 | 32.4 |
| Low Mn. Max (°C) |
30.5 | 29.9 | 29.5 | 29.9 | 30.3 | 27.9 | 27.2 | 27.8 | 30.0 | 31.8 | 32.2 | 31.5 | 30.8 |
| High Mn. Min (°C) |
25.6 | 25.6 | 24.8 | 24.4 | 23.4 | 21.7 | 19.9 | 20.5 | 22.7 | 24.5 | 25.7 | 26.4 | 23.2 |
| Low Mn. Min (°C) |
23.8 | 23.3 | 23.4 | 22.1 | 20.9 | 17.2 | 16.1 | 17.2 | 18.7 | 21.1 | 23.6 | 24.0 | 21.6 |
| High Rain (mm) |
545.1 | 513.8 | 718.9 | 601.8 | 123.2 | 135.9 | 36.6 | 22.0 | 23.9 | 115.8 | 445.2 | 784.8 | 2047.0 |
| Low Rain (mm) |
22.1 | 23.9 | 19.0 | 0.0 | 0.0 | 0.0 | 0.0 | 0.0 | 0.0 | 0.0 | 0.0 | 9.7 | 437.8 |
Milingimbi Annual Temperatures & Rainfall
Milingimbi Average Number of Days With Temperatures
| Jan | Feb | Mar | Apr | May | Jun | Jul | Aug | Sep | Oct | Nov | Dec | Ann | |
|---|---|---|---|---|---|---|---|---|---|---|---|---|---|
| ≥ 40°C |
0.0 | 0.0 | 0.0 | 0.0 | 0.0 | 0.0 | 0.0 | 0.0 | 0.0 | 0.0 | 0.0 | 0.0 | 0.0 |
| ≥ 35°C |
1.5 | 0.8 | 0.3 | 0.1 | 0.1 | 0.0 | 0.0 | 0.0 | 0.1 | 1.1 | 3.9 | 5.2 | 10.4 |
| ≥ 30°C |
23.3 | 21.8 | 23.0 | 22.3 | 21.1 | 11.4 | 6.8 | 15.0 | 24.4 | 26.8 | 26.4 | 25.2 | 200.1 |
| ≤ 2°C |
0.0 | 0.0 | 0.0 | 0.0 | 0.0 | 0.0 | 0.0 | 0.0 | 0.0 | 0.0 | 0.0 | 0.0 | 0.0 |
| ≤ 0°C |
0.0 | 0.0 | 0.0 | 0.0 | 0.0 | 0.0 | 0.0 | 0.0 | 0.0 | 0.0 | 0.0 | 0.0 | 0.0 |
Milingimbi 'per Week' Values (14th/86th Percentiles)
| Jan | Feb | Mar | Apr | May | Jun | Jul | Aug | Sep | Oct | Nov | Dec | Ann | |
|---|---|---|---|---|---|---|---|---|---|---|---|---|---|
| High Max |
34.0 | 33.3 | 33.0 | 33.0 | 32.2 | 31.0 | 30.3 | 31.1 | 32.5 | 34.0 | 35.0 | 35.0 | 33.6 |
| Low Max |
30.3 | 30.0 | 29.7 | 30.6 | 29.5 | 27.5 | 27.3 | 28.8 | 30.0 | 31.1 | 32.5 | 31.7 | 29.1 |
| High Min |
26.0 | 25.6 | 25.3 | 25.0 | 24.0 | 22.0 | 21.0 | 21.4 | 23.3 | 25.2 | 26.2 | 27.0 | 25.2 |
| Low Min |
23.2 | 23.2 | 23.2 | 22.0 | 19.7 | 16.7 | 15.8 | 16.6 | 18.8 | 21.0 | 23.2 | 23.4 | 19.0 |
Milingimbi Data Availability
| Jan | Feb | Mar | Apr | May | Jun | Jul | Aug | Sep | Oct | Nov | Dec | Ann | |
|---|---|---|---|---|---|---|---|---|---|---|---|---|---|
| Years of Minima |
27 | 27 | 26 | 24 | 25 | 23 | 23 | 24 | 26 | 24 | 24 | 25 | 24.9 |
| Earliest Entry |
1963 | 1963 | 1963 | 1963 | 1963 | 1963 | 1963 | 1963 | 1963 | 1963 | 1963 | 1963 | 1963 |
| Latest Entry |
2003 | 2003 | 2002 | 2002 | 2002 | 2002 | 2002 | 2002 | 2002 | 2002 | 2002 | 2002 | 2003 |
| Years of Maxima |
25 | 26 | 24 | 23 | 24 | 23 | 23 | 25 | 25 | 24 | 24 | 24 | 24.2 |
| Earliest Entry |
1963 | 1963 | 1963 | 1963 | 1963 | 1963 | 1963 | 1963 | 1963 | 1963 | 1963 | 1963 | 1963 |
| Latest Entry |
2003 | 2003 | 2002 | 2002 | 2002 | 2002 | 2002 | 2002 | 2002 | 2002 | 2002 | 2002 | 2003 |
| Years of Rainfall |
64 | 63 | 63 | 62 | 65 | 68 | 69 | 67 | 67 | 67 | 65 | 65 | 65.4 |
| Earliest Entry |
1925 | 1925 | 1925 | 1924 | 1924 | 1923 | 1923 | 1923 | 1923 | 1923 | 1923 | 1923 | 1923 |
| Latest Entry |
2003 | 2003 | 2003 | 2003 | 2002 | 2002 | 2002 | 2002 | 2002 | 2002 | 2002 | 2002 | 2003 |
Station Details
MILINGIMBI
Arnhem, Northern Territory
Arnhem, Northern Territory
12.1239°S 134.9078°E
4m AMSL
Commenced 1923 / Closed 2003
Commenced 1923 / Closed 2003
Enter a postcode or town name for local weather, or text to search the site. » advanced search
Generation gone with the wind
13:20 AEST A weeklong stretch of low wind power was broken on Wednesday evening, as a weak cold front marched across southern Australia. The chart below shows that the National Electricity Market (NEM) has endured a weeklong stretch of low wind generation, with wind power providing around 6% of the NEM’s electricity, down from last year’s average of 13.1% (Mon, April 15 to Wed, April 17).
- 11:29 AEST Devilishly dry in Tasmania
- 16:41 AEST Dubai deluge: a year's rainfall in a day
- 11:37 AEST Melbourne weather strongly out of character
- 15:03 AEST BoM declares El Niño over