- WEATHER
Australia
- National
- New South Wales
- Victoria
- Queensland
- Western Australia
- South Australia
- Tasmania
- ACT
- Northern Territory
Long Range Forecasts
- WARNINGS
- RADAR
- SATELLITE
- MAPS & CHARTS
- LONG RANGE
Long Range Forecasts
- CLIMATE
Climate Indicators
- NEWS
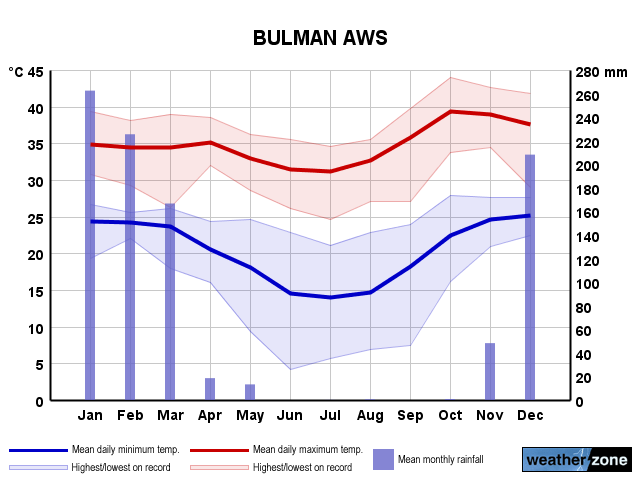
Bulman Long-term Averages
| Jan | Feb | Mar | Apr | May | Jun | Jul | Aug | Sep | Oct | Nov | Dec | Ann | |
|---|---|---|---|---|---|---|---|---|---|---|---|---|---|
| Mean Max (°C) |
35.1 | 34.8 | 34.7 | 34.4 | 32.6 | 30.6 | 31.0 | 32.9 | 36.2 | 38.3 | 38.8 | 37.2 | 34.7 |
| Mean Min (°C) |
24.5 | 24.1 | 23.3 | 20.9 | 18.4 | 15.4 | 14.2 | 14.5 | 18.1 | 22.0 | 24.3 | 24.8 | 20.2 |
| Mean Rain (mm) |
246.8 | 232.4 | 218.9 | 64.1 | 15.3 | 1.2 | 1.1 | 0.8 | 12.8 | 20.5 | 60.1 | 193.9 | 1013.5 |
| Median Rain (mm) |
256.2 | 155.6 | 255.2 | 34.6 | 8.0 | 0.0 | 0.0 | 0.0 | 0.0 | 0.2 | 36.6 | 222.2 | 1084.6 |
| Mean Rain Days |
19.4 | 17.1 | 14.7 | 6.9 | 2.4 | 0.6 | 0.6 | 0.2 | 0.5 | 2.6 | 6.3 | 13.3 | 82.3 |
Bulman Daily Records
| Jan | Feb | Mar | Apr | May | Jun | Jul | Aug | Sep | Oct | Nov | Dec | Ann | |
|---|---|---|---|---|---|---|---|---|---|---|---|---|---|
| High Max (°C) |
40.8 | 40.8 | 41.5 | 57.5 | 47.0 | 36.1 | 37.0 | 37.6 | 41.0 | 44.0 | 42.9 | 43.6 | 57.5 |
| Low Max (°C) |
27.4 | 25.6 | 24.3 | 25.7 | 21.3 | 20.1 | 22.1 | 20.8 | 24.5 | 27.7 | 27.8 | 26.4 | 20.1 |
| High Min (°C) |
28.0 | 28.0 | 26.2 | 25.4 | 25.3 | 24.6 | 23.7 | 23.9 | 26.7 | 27.9 | 28.8 | 28.7 | 28.8 |
| Low Min (°C) |
10.0 | 16.9 | 15.9 | 11.8 | 8.9 | 3.6 | 4.4 | 6.0 | -7.7 | 12.4 | -13.8 | 18.9 | -13.8 |
| High Rain (mm) |
101.4 | 105.8 | 442.8 | 105.0 | 55.8 | 11.0 | 7.2 | 6.0 | 122.8 | 59.0 | 93.8 | 155.2 | 442.8 |
Bulman Monthly Records
| Jan | Feb | Mar | Apr | May | Jun | Jul | Aug | Sep | Oct | Nov | Dec | Ann | |
|---|---|---|---|---|---|---|---|---|---|---|---|---|---|
| High Mn. Max (°C) |
38.0 | 37.4 | 37.6 | 37.1 | 35.2 | 33.3 | 33.1 | 34.5 | 37.6 | 39.4 | 40.5 | 40.8 | 35.9 |
| Low Mn. Max (°C) |
33.7 | 32.5 | 32.5 | 31.7 | 30.4 | 27.4 | 29.1 | 31.1 | 34.3 | 35.3 | 35.5 | 34.9 | 32.4 |
| High Mn. Min (°C) |
25.2 | 25.2 | 24.5 | 23.0 | 22.3 | 19.4 | 18.3 | 16.6 | 22.3 | 25.0 | 25.9 | 25.8 | 22.0 |
| Low Mn. Min (°C) |
24.0 | 23.1 | 21.2 | 17.2 | 15.1 | 10.9 | 10.2 | 10.9 | 15.2 | 18.3 | 22.7 | 23.8 | 18.5 |
| High Rain (mm) |
448.6 | 507.2 | 566.0 | 241.8 | 73.0 | 19.2 | 9.0 | 7.4 | 230.8 | 203.4 | 145.2 | 378.0 | 1883.8 |
| Low Rain (mm) |
58.0 | 61.0 | 59.0 | 0.0 | 0.0 | 0.0 | 0.0 | 0.0 | 0.0 | 0.0 | 5.6 | 41.4 | 631.2 |
Bulman Annual Temperatures & Rainfall
Bulman Average Number of Days With Temperatures
| Jan | Feb | Mar | Apr | May | Jun | Jul | Aug | Sep | Oct | Nov | Dec | Ann | |
|---|---|---|---|---|---|---|---|---|---|---|---|---|---|
| ≥ 40°C |
0.2 | 0.1 | 0.2 | 0.1 | 0.1 | 0.0 | 0.0 | 0.0 | 0.1 | 4.7 | 7.7 | 4.9 | 17.7 |
| ≥ 35°C |
16.7 | 14.2 | 15.1 | 12.0 | 3.3 | 0.7 | 0.7 | 4.9 | 23.6 | 29.4 | 28.6 | 23.8 | 164.7 |
| ≥ 30°C |
30.2 | 27.1 | 29.7 | 29.4 | 27.1 | 18.9 | 22.4 | 27.9 | 29.2 | 30.9 | 29.7 | 29.1 | 317.6 |
| ≤ 2°C |
0.0 | 0.0 | 0.0 | 0.0 | 0.0 | 0.0 | 0.0 | 0.0 | 0.1 | 0.0 | 0.1 | 0.0 | 0.0 |
| ≤ 0°C |
0.0 | 0.0 | 0.0 | 0.0 | 0.0 | 0.0 | 0.0 | 0.0 | 0.1 | 0.0 | 0.1 | 0.0 | 0.0 |
Bulman 'per Week' Values (14th/86th Percentiles)
| Jan | Feb | Mar | Apr | May | Jun | Jul | Aug | Sep | Oct | Nov | Dec | Ann | |
|---|---|---|---|---|---|---|---|---|---|---|---|---|---|
| High Max |
36.5 | 36.7 | 36.1 | 35.8 | 34.3 | 33.2 | 33.1 | 34.7 | 38.2 | 40.3 | 40.5 | 40.2 | 38.9 |
| Low Max |
32.4 | 31.9 | 32.0 | 32.8 | 31.0 | 27.5 | 28.5 | 30.2 | 33.7 | 36.5 | 37.7 | 34.3 | 30.9 |
| High Min |
25.3 | 25.1 | 24.4 | 23.1 | 22.4 | 19.1 | 17.8 | 18.5 | 21.8 | 24.6 | 25.9 | 26.1 | 24.8 |
| Low Min |
23.7 | 22.9 | 21.4 | 16.8 | 14.0 | 9.8 | 8.7 | 10.6 | 14.2 | 18.5 | 22.3 | 23.7 | 13.7 |
Bulman Data Availability
| Jan | Feb | Mar | Apr | May | Jun | Jul | Aug | Sep | Oct | Nov | Dec | Ann | |
|---|---|---|---|---|---|---|---|---|---|---|---|---|---|
| Years of Minima |
17 | 18 | 18 | 16 | 18 | 18 | 17 | 17 | 19 | 18 | 19 | 19 | 18.0 |
| Earliest Entry |
2004 | 2004 | 2004 | 2004 | 2004 | 2004 | 2004 | 2003 | 2003 | 2002 | 2002 | 2002 | 2002 |
| Latest Entry |
2024 | 2024 | 2024 | 2023 | 2023 | 2023 | 2023 | 2023 | 2023 | 2023 | 2023 | 2023 | 2024 |
| Years of Maxima |
18 | 19 | 18 | 16 | 18 | 18 | 17 | 18 | 19 | 18 | 19 | 21 | 18.0 |
| Earliest Entry |
2004 | 2004 | 2004 | 2004 | 2004 | 2004 | 2004 | 2003 | 2003 | 2002 | 2002 | 2002 | 2002 |
| Latest Entry |
2024 | 2024 | 2024 | 2023 | 2023 | 2023 | 2023 | 2023 | 2023 | 2023 | 2023 | 2023 | 2024 |
| Years of Rainfall |
19 | 19 | 19 | 17 | 19 | 20 | 19 | 20 | 21 | 20 | 21 | 21 | 19.0 |
| Earliest Entry |
2004 | 2004 | 2004 | 2004 | 2004 | 2004 | 2003 | 2003 | 2003 | 2002 | 2002 | 2002 | 2002 |
| Latest Entry |
2024 | 2024 | 2024 | 2023 | 2023 | 2023 | 2023 | 2023 | 2023 | 2023 | 2023 | 2023 | 2024 |
Station Details
BULMAN
Roper-McArthur, Northern Territory
Roper-McArthur, Northern Territory
13.6715°S 134.3415°E
104m AMSL
Commenced 2002
Commenced 2002
Enter a postcode or town name for local weather, or text to search the site. » advanced search
A very wet weekend for southeast Qld, northeast NSW
11:48 AEST A prolonged rainfall event is set to bring large totals to parts of NSW and Qld from Saturday, with possible heavy falls and flooding. A low-pressure system in the Coral Sea, a deepening coastal trough and persistent easterlies will bring moisture-laden air into southeast Qld and northeast NSW will bring days of rainfall to the region. While there is not a drop of rain on the radar over southeast Qld and Northeast NSW on Friday morning, the mass of cloud associated with a low in the Coral Sea will enhance rainfall over the weekend.
- 10:07 AEST Southerly surges across the southeast
- 13:20 AEST Generation gone with the wind
- 11:29 AEST Devilishly dry in Tasmania
- 16:41 AEST Dubai deluge: a year's rainfall in a day