- WEATHER
Australia
- National
- New South Wales
- Victoria
- Queensland
- Western Australia
- South Australia
- Tasmania
- ACT
- Northern Territory
Long Range Forecasts
- WARNINGS
- RADAR
- SATELLITE
- MAPS & CHARTS
- LONG RANGE
Long Range Forecasts
- CLIMATE
Climate Indicators
- NEWS
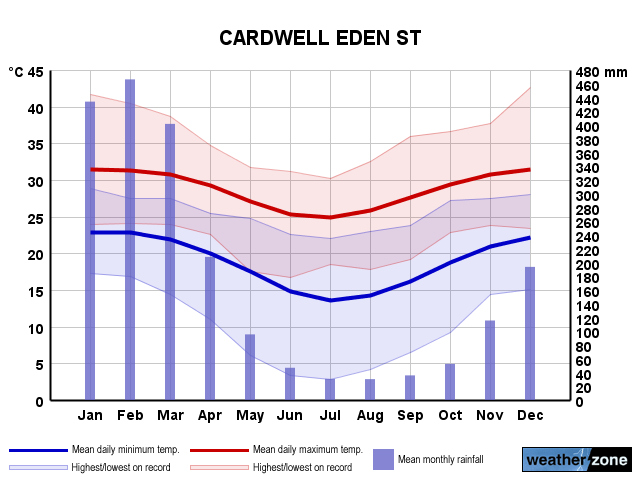
Cardwell Long-term Averages
| Jan | Feb | Mar | Apr | May | Jun | Jul | Aug | Sep | Oct | Nov | Dec | Ann | |
|---|---|---|---|---|---|---|---|---|---|---|---|---|---|
| Mean Max (°C) |
31.6 | 31.4 | 30.9 | 29.3 | 27.2 | 25.5 | 25.0 | 26.0 | 27.7 | 29.3 | 30.6 | 31.5 | 28.8 |
| Mean Min (°C) |
23.5 | 23.5 | 22.6 | 20.9 | 18.5 | 15.7 | 14.5 | 15.2 | 17.3 | 19.8 | 21.8 | 23.0 | 19.7 |
| Mean Rain (mm) |
439.0 | 457.7 | 389.6 | 198.1 | 96.7 | 42.9 | 31.7 | 26.9 | 36.8 | 54.5 | 115.6 | 201.0 | 2091.5 |
| Median Rain (mm) |
377.7 | 414.1 | 316.8 | 153.3 | 77.2 | 32.0 | 21.0 | 21.6 | 20.8 | 36.6 | 85.7 | 138.8 | 2013.0 |
| Mean Rain Days |
16.1 | 16.4 | 16.9 | 14.7 | 11.8 | 7.8 | 6.2 | 5.8 | 5.8 | 7.0 | 9.2 | 11.7 | 129.9 |
Cardwell Daily Records
| Jan | Feb | Mar | Apr | May | Jun | Jul | Aug | Sep | Oct | Nov | Dec | Ann | |
|---|---|---|---|---|---|---|---|---|---|---|---|---|---|
| High Max (°C) |
41.7 | 41.8 | 38.7 | 34.7 | 31.7 | 31.1 | 30.2 | 32.5 | 36.0 | 36.6 | 40.0 | 42.6 | 42.6 |
| Low Max (°C) |
23.9 | 24.1 | 23.9 | 22.6 | 17.5 | 16.7 | 16.0 | 17.8 | 19.1 | 22.1 | 23.8 | 23.4 | 16.0 |
| High Min (°C) |
28.8 | 28.3 | 29.1 | 25.5 | 24.7 | 22.9 | 22.1 | 23.0 | 24.2 | 27.2 | 27.5 | 28.1 | 29.1 |
| Low Min (°C) |
17.2 | 16.8 | 14.4 | 11.0 | 6.1 | 3.3 | 2.8 | 4.2 | 6.5 | 9.2 | 14.4 | 15.1 | 2.8 |
| High Rain (mm) |
527.1 | 391.4 | 463.3 | 326.1 | 205.7 | 114.5 | 166.1 | 83.6 | 174.4 | 185.0 | 213.6 | 335.3 | 527.1 |
Cardwell Monthly Records
| Jan | Feb | Mar | Apr | May | Jun | Jul | Aug | Sep | Oct | Nov | Dec | Ann | |
|---|---|---|---|---|---|---|---|---|---|---|---|---|---|
| High Mn. Max (°C) |
34.2 | 34.3 | 32.7 | 30.9 | 28.9 | 27.5 | 27.1 | 28.6 | 30.0 | 32.3 | 33.1 | 34.0 | 30.1 |
| Low Mn. Max (°C) |
28.7 | 29.3 | 28.9 | 27.6 | 25.6 | 22.6 | 22.9 | 23.4 | 25.5 | 27.2 | 28.2 | 28.9 | 27.0 |
| High Mn. Min (°C) |
24.9 | 24.7 | 24.4 | 23.0 | 21.7 | 19.1 | 18.9 | 17.6 | 21.2 | 22.8 | 23.5 | 24.6 | 21.3 |
| Low Mn. Min (°C) |
21.4 | 21.9 | 20.9 | 18.5 | 15.2 | 11.0 | 10.4 | 12.3 | 13.1 | 16.1 | 20.2 | 21.0 | 18.3 |
| High Rain (mm) |
1836.0 | 1330.5 | 1065.8 | 1178.8 | 347.4 | 199.2 | 190.6 | 122.7 | 336.0 | 328.0 | 653.2 | 1051.8 | 4087.7 |
| Low Rain (mm) |
5.6 | 36.3 | 25.1 | 1.0 | 0.0 | 0.0 | 0.0 | 0.0 | 0.0 | 0.0 | 0.0 | 0.0 | 900.4 |
Cardwell Annual Temperatures & Rainfall
Cardwell Average Number of Days With Temperatures
| Jan | Feb | Mar | Apr | May | Jun | Jul | Aug | Sep | Oct | Nov | Dec | Ann | |
|---|---|---|---|---|---|---|---|---|---|---|---|---|---|
| ≥ 40°C |
0.0 | 0.1 | 0.0 | 0.0 | 0.0 | 0.0 | 0.0 | 0.0 | 0.0 | 0.0 | 0.0 | 0.0 | 0.2 |
| ≥ 35°C |
1.4 | 1.4 | 0.6 | 0.0 | 0.0 | 0.0 | 0.0 | 0.0 | 0.0 | 0.0 | 0.2 | 0.8 | 4.6 |
| ≥ 30°C |
25.2 | 21.4 | 22.2 | 10.9 | 1.5 | 0.2 | 0.0 | 0.4 | 2.6 | 11.3 | 19.8 | 25.5 | 140.1 |
| ≤ 2°C |
0.0 | 0.0 | 0.0 | 0.0 | 0.0 | 0.0 | 0.0 | 0.0 | 0.0 | 0.0 | 0.0 | 0.0 | 0.0 |
| ≤ 0°C |
0.0 | 0.0 | 0.0 | 0.0 | 0.0 | 0.0 | 0.0 | 0.0 | 0.0 | 0.0 | 0.0 | 0.0 | 0.0 |
Cardwell 'per Week' Values (14th/86th Percentiles)
| Jan | Feb | Mar | Apr | May | Jun | Jul | Aug | Sep | Oct | Nov | Dec | Ann | |
|---|---|---|---|---|---|---|---|---|---|---|---|---|---|
| High Max |
33.8 | 33.9 | 32.8 | 31.2 | 29.2 | 27.5 | 26.9 | 28.0 | 29.5 | 31.1 | 32.3 | 33.3 | 32.2 |
| Low Max |
29.6 | 29.0 | 28.9 | 27.3 | 25.5 | 23.6 | 23.3 | 24.4 | 26.2 | 27.7 | 29.1 | 30.0 | 25.6 |
| High Min |
24.9 | 24.8 | 24.1 | 22.9 | 21.2 | 19.4 | 18.5 | 18.7 | 20.3 | 22.5 | 24.0 | 24.9 | 23.7 |
| Low Min |
21.8 | 22.2 | 20.9 | 18.5 | 15.4 | 11.1 | 9.5 | 11.3 | 13.8 | 16.7 | 19.4 | 21.0 | 14.7 |
Cardwell Data Availability
| Jan | Feb | Mar | Apr | May | Jun | Jul | Aug | Sep | Oct | Nov | Dec | Ann | |
|---|---|---|---|---|---|---|---|---|---|---|---|---|---|
| Years of Minima |
68 | 67 | 64 | 62 | 65 | 65 | 64 | 65 | 64 | 66 | 66 | 67 | 65.0 |
| Earliest Entry |
1957 | 1957 | 1957 | 1957 | 1957 | 1957 | 1957 | 1957 | 1957 | 1958 | 1957 | 1957 | 1957 |
| Latest Entry |
2024 | 2024 | 2024 | 2023 | 2023 | 2023 | 2023 | 2023 | 2023 | 2023 | 2023 | 2023 | 2024 |
| Years of Maxima |
68 | 67 | 64 | 64 | 66 | 65 | 64 | 66 | 65 | 66 | 66 | 67 | 65.0 |
| Earliest Entry |
1957 | 1957 | 1957 | 1957 | 1957 | 1957 | 1957 | 1957 | 1957 | 1958 | 1957 | 1957 | 1957 |
| Latest Entry |
2024 | 2024 | 2024 | 2023 | 2023 | 2023 | 2023 | 2023 | 2023 | 2023 | 2023 | 2023 | 2024 |
| Years of Rainfall |
135 | 137 | 134 | 135 | 135 | 136 | 138 | 139 | 137 | 139 | 138 | 137 | 135.0 |
| Earliest Entry |
1888 | 1887 | 1888 | 1887 | 1887 | 1880 | 1875 | 1874 | 1882 | 1876 | 1880 | 1881 | 1874 |
| Latest Entry |
2024 | 2024 | 2024 | 2023 | 2023 | 2023 | 2023 | 2023 | 2023 | 2023 | 2023 | 2023 | 2024 |
Station Details
CARDWELL MARINE PDE
North Coast & Tableland, Queensland
North Coast & Tableland, Queensland
18.2544°S 146.0192°E
5m AMSL
Commenced 1871
Commenced 1871
Enter a postcode or town name for local weather, or text to search the site. » advanced search
A very wet weekend for southeast Qld, northeast NSW
11:48 AEST A prolonged rainfall event is set to bring large totals to parts of NSW and Qld from Saturday, with possible heavy falls and flooding. A low-pressure system in the Coral Sea, a deepening coastal trough and persistent easterlies will bring moisture-laden air into southeast Qld and northeast NSW will bring days of rainfall to the region. While there is not a drop of rain on the radar over southeast Qld and Northeast NSW on Friday morning, the mass of cloud associated with a low in the Coral Sea will enhance rainfall over the weekend.
- 10:07 AEST Southerly surges across the southeast
- 13:20 AEST Generation gone with the wind
- 11:29 AEST Devilishly dry in Tasmania
- 16:41 AEST Dubai deluge: a year's rainfall in a day