- WEATHER
Australia
- National
- New South Wales
- Victoria
- Queensland
- Western Australia
- South Australia
- Tasmania
- ACT
- Northern Territory
Long Range Forecasts
- WARNINGS
- RADAR
- SATELLITE
- MAPS & CHARTS
- LONG RANGE
Long Range Forecasts
- CLIMATE
Climate Indicators
- NEWS
Guyra Long-term Averages
| Jan | Feb | Mar | Apr | May | Jun | Jul | Aug | Sep | Oct | Nov | Dec | Ann | |
|---|---|---|---|---|---|---|---|---|---|---|---|---|---|
| Mean Max (°C) |
24.3 | 23.2 | 21.4 | 18.0 | 14.5 | 11.2 | 10.6 | 12.3 | 15.6 | 18.7 | 20.8 | 22.9 | 17.8 |
| Mean Min (°C) |
12.3 | 11.9 | 10.3 | 7.0 | 4.0 | 1.9 | 0.8 | 1.3 | 3.9 | 6.5 | 8.9 | 10.8 | 6.6 |
| Mean Rain (mm) |
117.9 | 103.1 | 76.8 | 48.4 | 51.0 | 50.8 | 57.2 | 53.2 | 56.1 | 74.9 | 103.1 | 109.7 | 904.0 |
| Median Rain (mm) |
108.2 | 102.7 | 51.7 | 39.4 | 43.8 | 42.1 | 43.2 | 47.6 | 55.8 | 71.4 | 90.2 | 101.7 | 916.9 |
| Mean Rain Days |
11.4 | 11.2 | 10.4 | 8.5 | 9.4 | 11.0 | 10.6 | 8.5 | 8.2 | 9.8 | 11.1 | 11.6 | 121.5 |
Guyra Daily Records
| Jan | Feb | Mar | Apr | May | Jun | Jul | Aug | Sep | Oct | Nov | Dec | Ann | |
|---|---|---|---|---|---|---|---|---|---|---|---|---|---|
| High Max (°C) |
34.4 | 35.1 | 30.2 | 27.0 | 21.6 | 19.1 | 18.7 | 25.2 | 26.0 | 29.3 | 33.2 | 34.6 | 35.1 |
| Low Max (°C) |
13.5 | 12.8 | 12.8 | 7.5 | 3.5 | 2.2 | -0.3 | 1.6 | 4.3 | 6.5 | 5.7 | 10.7 | -0.3 |
| High Min (°C) |
20.6 | 21.2 | 21.1 | 15.4 | 12.5 | 11.5 | 12.1 | 12.6 | 15.6 | 18.0 | 19.2 | 19.5 | 21.2 |
| Low Min (°C) |
1.4 | 3.5 | -0.3 | -2.8 | -6.0 | -6.5 | -7.1 | -7.0 | -5.5 | -4.0 | -2.6 | 1.3 | -7.1 |
| High Rain (mm) |
63.4 | 90.4 | 67.8 | 49.6 | 49.0 | 52.6 | 70.0 | 54.8 | 49.2 | 60.8 | 105.0 | 79.4 | 105.0 |
Guyra Monthly Records
| Jan | Feb | Mar | Apr | May | Jun | Jul | Aug | Sep | Oct | Nov | Dec | Ann | |
|---|---|---|---|---|---|---|---|---|---|---|---|---|---|
| High Mn. Max (°C) |
28.7 | 26.4 | 25.8 | 21.0 | 17.5 | 13.2 | 13.2 | 16.2 | 19.3 | 21.8 | 25.5 | 27.9 | 20.3 |
| Low Mn. Max (°C) |
20.7 | 20.3 | 17.8 | 15.9 | 12.6 | 9.0 | 7.8 | 8.1 | 12.2 | 16.1 | 16.8 | 19.1 | 16.3 |
| High Mn. Min (°C) |
15.3 | 14.2 | 12.3 | 9.5 | 6.7 | 4.0 | 3.9 | 3.3 | 6.0 | 8.9 | 11.7 | 12.9 | 7.4 |
| Low Mn. Min (°C) |
9.7 | 9.5 | 7.5 | 4.8 | 0.8 | -1.0 | -2.2 | -0.6 | 0.6 | 4.3 | 5.8 | 7.0 | 5.3 |
| High Rain (mm) |
286.1 | 250.4 | 216.5 | 189.6 | 153.4 | 136.0 | 149.2 | 138.0 | 142.4 | 166.2 | 250.2 | 221.2 | 1199.6 |
| Low Rain (mm) |
8.9 | 8.6 | 3.6 | 2.0 | 6.4 | 3.6 | 3.8 | 3.0 | 2.0 | 13.4 | 15.0 | 27.6 | 302.0 |
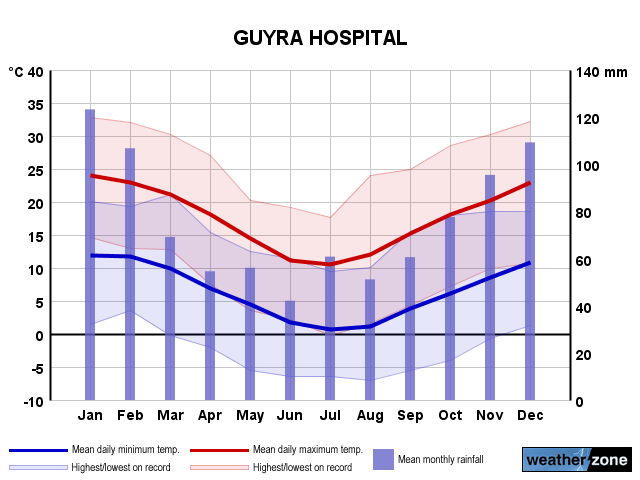
Guyra Annual Temperatures & Rainfall
Guyra Average Number of Days With Temperatures
| Jan | Feb | Mar | Apr | May | Jun | Jul | Aug | Sep | Oct | Nov | Dec | Ann | |
|---|---|---|---|---|---|---|---|---|---|---|---|---|---|
| ≥ 40°C |
0.0 | 0.0 | 0.0 | 0.0 | 0.0 | 0.0 | 0.0 | 0.0 | 0.0 | 0.0 | 0.0 | 0.0 | 0.0 |
| ≥ 35°C |
0.0 | 0.0 | 0.0 | 0.0 | 0.0 | 0.0 | 0.0 | 0.0 | 0.0 | 0.0 | 0.0 | 0.0 | 0.0 |
| ≥ 30°C |
1.7 | 1.0 | 0.1 | 0.0 | 0.0 | 0.0 | 0.0 | 0.0 | 0.0 | 0.0 | 0.4 | 1.0 | 4.3 |
| ≤ 2°C |
0.0 | 0.0 | 0.1 | 1.6 | 8.5 | 15.9 | 20.9 | 19.2 | 9.8 | 3.2 | 0.7 | 0.1 | 79.7 |
| ≤ 0°C |
0.0 | 0.0 | 0.0 | 0.6 | 3.5 | 9.2 | 13.2 | 12.2 | 4.0 | 0.8 | 0.1 | 0.0 | 43.5 |
Guyra 'per Week' Values (14th/86th Percentiles)
| Jan | Feb | Mar | Apr | May | Jun | Jul | Aug | Sep | Oct | Nov | Dec | Ann | |
|---|---|---|---|---|---|---|---|---|---|---|---|---|---|
| High Max |
27.6 | 26.5 | 24.5 | 20.8 | 17.3 | 14.0 | 13.2 | 15.5 | 19.2 | 22.5 | 25.0 | 26.4 | 24.0 |
| Low Max |
20.0 | 19.7 | 18.0 | 14.6 | 11.5 | 8.0 | 7.0 | 8.5 | 11.0 | 14.1 | 15.7 | 18.5 | 11.0 |
| High Min |
15.0 | 14.6 | 12.6 | 10.1 | 7.6 | 5.3 | 4.0 | 4.7 | 8.0 | 10.1 | 12.5 | 14.0 | 12.1 |
| Low Min |
8.8 | 8.8 | 7.2 | 3.7 | 0.6 | -1.8 | -2.7 | -2.0 | 0.0 | 2.5 | 4.7 | 7.2 | 0.5 |
Guyra Data Availability
| Jan | Feb | Mar | Apr | May | Jun | Jul | Aug | Sep | Oct | Nov | Dec | Ann | |
|---|---|---|---|---|---|---|---|---|---|---|---|---|---|
| Years of Minima |
43 | 43 | 43 | 41 | 41 | 41 | 41 | 41 | 42 | 42 | 42 | 42 | 42.0 |
| Earliest Entry |
1982 | 1982 | 1982 | 1982 | 1982 | 1982 | 1982 | 1982 | 1981 | 1981 | 1981 | 1981 | 1981 |
| Latest Entry |
2024 | 2024 | 2024 | 2024 | 2023 | 2023 | 2023 | 2023 | 2023 | 2023 | 2023 | 2023 | 2024 |
| Years of Maxima |
43 | 43 | 43 | 41 | 41 | 41 | 41 | 41 | 43 | 42 | 42 | 42 | 41.0 |
| Earliest Entry |
1982 | 1982 | 1982 | 1982 | 1982 | 1982 | 1982 | 1982 | 1981 | 1981 | 1981 | 1981 | 1981 |
| Latest Entry |
2024 | 2024 | 2024 | 2024 | 2023 | 2023 | 2023 | 2023 | 2023 | 2023 | 2023 | 2023 | 2024 |
| Years of Rainfall |
43 | 43 | 43 | 42 | 42 | 42 | 42 | 42 | 43 | 43 | 43 | 43 | 42.0 |
| Earliest Entry |
1982 | 1982 | 1982 | 1982 | 1982 | 1982 | 1982 | 1982 | 1981 | 1981 | 1981 | 1981 | 1981 |
| Latest Entry |
2024 | 2024 | 2024 | 2024 | 2023 | 2023 | 2023 | 2023 | 2023 | 2023 | 2023 | 2023 | 2024 |
Station Details
GUYRA HOSPITAL
Northern Tablelands, New South Wales/ACT
Northern Tablelands, New South Wales/ACT
30.2122°S 151.6794°E
1329m AMSL
Commenced 1981
Commenced 1981
Enter a postcode or town name for local weather, or text to search the site. » advanced search
Satellites capture huge dust storm crossing Mediterranean Sea
14:32 AEST Images captured from satellites have revealed the colossal scale of a dust storm that turned the sky orange in parts of Greece earlier this week.
- 08:00 AEST A digger's letter from snowbound Gallipoli
- 15:39 AEST Summery Sydney, wintry Melbourne
- 13:00 AEST Rainfall to soak some parched areas of WA
- 10:33 AEST Tassie snow, Melbourne temps go low