- WEATHER
Australia
- National
- New South Wales
- Victoria
- Queensland
- Western Australia
- South Australia
- Tasmania
- ACT
- Northern Territory
Long Range Forecasts
- WARNINGS
- RADAR
- SATELLITE
- MAPS & CHARTS
- LONG RANGE
Long Range Forecasts
- CLIMATE
Climate Indicators
- NEWS
Inverell Long-term Averages
| Jan | Feb | Mar | Apr | May | Jun | Jul | Aug | Sep | Oct | Nov | Dec | Ann | |
|---|---|---|---|---|---|---|---|---|---|---|---|---|---|
| Mean Max (°C) |
31.0 | 30.1 | 28.3 | 24.7 | 20.4 | 17.2 | 16.6 | 18.5 | 21.9 | 25.0 | 27.2 | 29.3 | 24.1 |
| Mean Min (°C) |
15.5 | 14.9 | 12.4 | 7.6 | 3.5 | 1.4 | 0.1 | 0.6 | 4.1 | 8.0 | 11.7 | 14.0 | 7.7 |
| Mean Rain (mm) |
92.0 | 80.4 | 87.9 | 33.8 | 37.9 | 48.3 | 43.0 | 37.5 | 50.9 | 69.9 | 97.8 | 111.6 | 785.7 |
| Median Rain (mm) |
74.7 | 93.6 | 43.6 | 21.2 | 27.6 | 42.0 | 25.2 | 23.8 | 44.6 | 62.6 | 77.0 | 113.2 | 738.8 |
| Mean Rain Days |
9.9 | 8.6 | 8.2 | 5.3 | 5.6 | 7.4 | 7.7 | 6.2 | 6.8 | 8.8 | 10.6 | 11.6 | 95.9 |
Inverell Daily Records
| Jan | Feb | Mar | Apr | May | Jun | Jul | Aug | Sep | Oct | Nov | Dec | Ann | |
|---|---|---|---|---|---|---|---|---|---|---|---|---|---|
| High Max (°C) |
41.9 | 41.5 | 36.1 | 34.3 | 27.6 | 23.8 | 25.0 | 32.4 | 33.0 | 36.2 | 39.8 | 41.8 | 41.9 |
| Low Max (°C) |
19.4 | 18.0 | 18.1 | 13.8 | 10.2 | 7.2 | 7.9 | 8.2 | 10.8 | 12.0 | 15.6 | 16.9 | 7.2 |
| High Min (°C) |
23.9 | 23.4 | 20.5 | 17.9 | 17.9 | 14.0 | 14.3 | 13.1 | 15.5 | 18.4 | 22.0 | 22.5 | 23.9 |
| Low Min (°C) |
4.9 | 4.7 | -0.5 | -3.3 | -6.2 | -8.6 | -9.5 | -8.0 | -6.0 | -2.3 | -0.5 | 2.7 | -9.5 |
| High Rain (mm) |
70.4 | 95.4 | 98.4 | 45.0 | 59.0 | 41.2 | 62.6 | 34.6 | 58.6 | 71.4 | 84.4 | 74.4 | 98.4 |
Inverell Monthly Records
| Jan | Feb | Mar | Apr | May | Jun | Jul | Aug | Sep | Oct | Nov | Dec | Ann | |
|---|---|---|---|---|---|---|---|---|---|---|---|---|---|
| High Mn. Max (°C) |
35.0 | 32.9 | 31.7 | 28.0 | 22.8 | 19.1 | 18.8 | 21.9 | 25.3 | 27.6 | 32.0 | 34.5 | 26.7 |
| Low Mn. Max (°C) |
28.2 | 27.0 | 25.9 | 22.1 | 18.7 | 14.4 | 14.7 | 15.6 | 18.9 | 22.1 | 23.0 | 25.5 | 22.3 |
| High Mn. Min (°C) |
18.9 | 17.2 | 14.7 | 10.0 | 7.7 | 4.7 | 3.2 | 4.4 | 7.7 | 11.4 | 14.2 | 16.3 | 8.9 |
| Low Mn. Min (°C) |
12.2 | 12.0 | 8.6 | 3.9 | -0.9 | -1.4 | -5.5 | -2.3 | 1.4 | 5.2 | 8.7 | 10.7 | 6.0 |
| High Rain (mm) |
191.4 | 171.4 | 271.0 | 104.6 | 104.4 | 131.0 | 160.2 | 83.4 | 141.8 | 205.6 | 222.8 | 212.0 | 1267.0 |
| Low Rain (mm) |
21.6 | 1.8 | 0.2 | 2.2 | 0.0 | 6.2 | 2.8 | 0.0 | 2.2 | 6.0 | 10.0 | 5.4 | 241.2 |
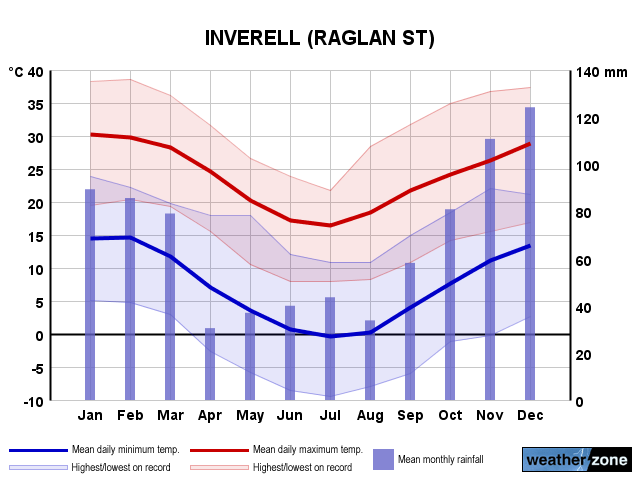
Inverell Annual Temperatures & Rainfall
Inverell Average Number of Days With Temperatures
| Jan | Feb | Mar | Apr | May | Jun | Jul | Aug | Sep | Oct | Nov | Dec | Ann | |
|---|---|---|---|---|---|---|---|---|---|---|---|---|---|
| ≥ 40°C |
0.1 | 0.1 | 0.0 | 0.0 | 0.0 | 0.0 | 0.0 | 0.0 | 0.0 | 0.0 | 0.0 | 0.0 | 0.2 |
| ≥ 35°C |
3.9 | 2.0 | 0.2 | 0.0 | 0.0 | 0.0 | 0.0 | 0.0 | 0.0 | 0.1 | 1.2 | 2.2 | 9.5 |
| ≥ 30°C |
20.1 | 15.1 | 8.5 | 0.6 | 0.0 | 0.0 | 0.0 | 0.1 | 0.4 | 2.7 | 7.8 | 13.6 | 67.3 |
| ≤ 2°C |
0.0 | 0.0 | 0.1 | 2.3 | 12.8 | 18.0 | 21.7 | 20.7 | 10.2 | 2.2 | 0.2 | 0.0 | 88.1 |
| ≤ 0°C |
0.0 | 0.0 | 0.0 | 0.8 | 6.6 | 12.9 | 17.5 | 16.1 | 4.8 | 0.4 | 0.1 | 0.0 | 59.1 |
Inverell 'per Week' Values (14th/86th Percentiles)
| Jan | Feb | Mar | Apr | May | Jun | Jul | Aug | Sep | Oct | Nov | Dec | Ann | |
|---|---|---|---|---|---|---|---|---|---|---|---|---|---|
| High Max |
34.1 | 32.9 | 31.0 | 27.6 | 23.2 | 20.2 | 18.9 | 21.6 | 25.7 | 28.7 | 31.3 | 32.5 | 30.5 |
| Low Max |
27.0 | 26.2 | 25.5 | 21.2 | 17.4 | 13.8 | 13.2 | 14.7 | 17.6 | 20.5 | 22.0 | 25.2 | 17.2 |
| High Min |
18.6 | 18.4 | 15.8 | 11.4 | 8.8 | 5.8 | 4.7 | 5.8 | 9.2 | 12.9 | 15.8 | 17.4 | 15.3 |
| Low Min |
11.0 | 11.0 | 8.1 | 3.0 | -1.6 | -3.8 | -4.5 | -4.4 | -0.2 | 3.2 | 6.5 | 9.6 | -1.0 |
Inverell Data Availability
| Jan | Feb | Mar | Apr | May | Jun | Jul | Aug | Sep | Oct | Nov | Dec | Ann | |
|---|---|---|---|---|---|---|---|---|---|---|---|---|---|
| Years of Minima |
28 | 29 | 29 | 27 | 29 | 29 | 29 | 29 | 29 | 29 | 28 | 29 | 29.0 |
| Earliest Entry |
1996 | 1996 | 1995 | 1995 | 1995 | 1995 | 1995 | 1995 | 1995 | 1995 | 1995 | 1995 | 1995 |
| Latest Entry |
2024 | 2024 | 2024 | 2023 | 2023 | 2023 | 2023 | 2023 | 2023 | 2023 | 2023 | 2023 | 2024 |
| Years of Maxima |
29 | 29 | 29 | 29 | 29 | 29 | 29 | 29 | 29 | 29 | 29 | 29 | 29.0 |
| Earliest Entry |
1996 | 1996 | 1995 | 1995 | 1995 | 1995 | 1995 | 1995 | 1995 | 1995 | 1995 | 1995 | 1995 |
| Latest Entry |
2024 | 2024 | 2024 | 2023 | 2023 | 2023 | 2023 | 2023 | 2023 | 2023 | 2023 | 2023 | 2024 |
| Years of Rainfall |
29 | 29 | 29 | 29 | 29 | 29 | 29 | 29 | 29 | 29 | 29 | 29 | 29.0 |
| Earliest Entry |
1996 | 1996 | 1995 | 1995 | 1995 | 1995 | 1995 | 1995 | 1995 | 1995 | 1995 | 1995 | 1995 |
| Latest Entry |
2024 | 2024 | 2024 | 2023 | 2023 | 2023 | 2023 | 2023 | 2023 | 2023 | 2023 | 2023 | 2024 |
Station Details
INVERELL (RAGLAN ST)
Northern Tablelands, New South Wales/ACT
Northern Tablelands, New South Wales/ACT
29.7796°S 151.1121°E
582m AMSL
Commenced 1995
Commenced 1995
Enter a postcode or town name for local weather, or text to search the site. » advanced search
Wind returning to southeastern Australia
10:07 AEST After a prolonged period of light winds, a surge of powerful winds and cool air will push through southeastern Australia during the next 48 hours. As we wrote about last week the National Electricity Market (NEM) saw very low wind power generation during the seven days leading up to Thursday, April 18, with the daily wind generation having been under 41 GWh/day for this period. Wind power has improved slightly during the past week, with wind power increasing for a few days over last weekend.