- WEATHER
Australia
- National
- New South Wales
- Victoria
- Queensland
- Western Australia
- South Australia
- Tasmania
- ACT
- Northern Territory
Long Range Forecasts
- WARNINGS
- RADAR
- SATELLITE
- MAPS & CHARTS
- LONG RANGE
Long Range Forecasts
- CLIMATE
Climate Indicators
- NEWS
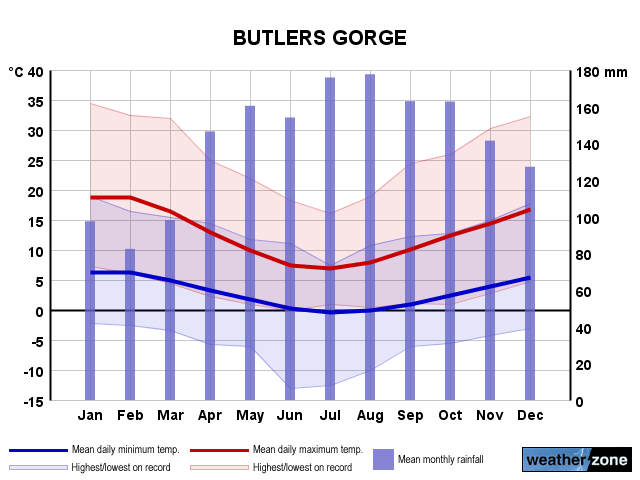
Butlers Gorge Long-term Averages
| Jan | Feb | Mar | Apr | May | Jun | Jul | Aug | Sep | Oct | Nov | Dec | Ann | |
|---|---|---|---|---|---|---|---|---|---|---|---|---|---|
| Mean Max (°C) |
19.0 | 18.9 | 16.6 | 13.2 | 10.1 | 7.8 | 7.1 | 8.1 | 10.3 | 12.6 | 14.9 | 16.9 | 12.9 |
| Mean Min (°C) |
6.4 | 6.2 | 5.2 | 3.5 | 1.8 | 0.3 | -0.3 | 0.0 | 1.0 | 2.4 | 4.0 | 5.5 | 3.0 |
| Mean Rain (mm) |
92.1 | 79.2 | 101.2 | 139.0 | 162.6 | 151.1 | 177.0 | 185.1 | 168.5 | 159.0 | 135.3 | 123.3 | 1662.4 |
| Median Rain (mm) |
97.1 | 68.3 | 84.7 | 135.2 | 135.5 | 134.2 | 160.6 | 162.6 | 166.8 | 145.4 | 131.3 | 121.5 | 1619.1 |
| Mean Rain Days |
15.0 | 13.1 | 16.9 | 20.1 | 22.8 | 21.8 | 24.0 | 24.3 | 22.3 | 21.4 | 19.4 | 18.1 | 238.3 |
Butlers Gorge Daily Records
| Jan | Feb | Mar | Apr | May | Jun | Jul | Aug | Sep | Oct | Nov | Dec | Ann | |
|---|---|---|---|---|---|---|---|---|---|---|---|---|---|
| High Max (°C) |
34.4 | 33.5 | 32.0 | 25.0 | 22.0 | 18.3 | 16.1 | 18.9 | 24.4 | 28.5 | 30.3 | 32.9 | 34.4 |
| Low Max (°C) |
5.6 | 6.1 | 3.2 | 1.7 | 1.0 | 0.0 | -0.6 | -1.1 | 0.0 | 1.0 | 2.8 | 4.7 | -1.1 |
| High Min (°C) |
19.4 | 18.2 | 16.4 | 14.4 | 11.7 | 10.0 | 8.4 | 10.8 | 12.3 | 13.7 | 15.0 | 17.9 | 19.4 |
| Low Min (°C) |
-2.8 | -2.5 | -4.4 | -5.7 | -6.7 | -13.0 | -12.5 | -12.2 | -6.5 | -5.7 | -5.5 | -3.3 | -13.0 |
| High Rain (mm) |
55.8 | 69.3 | 81.4 | 131.6 | 78.0 | 91.4 | 51.8 | 68.6 | 61.8 | 61.7 | 66.8 | 59.2 | 131.6 |
Butlers Gorge Monthly Records
| Jan | Feb | Mar | Apr | May | Jun | Jul | Aug | Sep | Oct | Nov | Dec | Ann | |
|---|---|---|---|---|---|---|---|---|---|---|---|---|---|
| High Mn. Max (°C) |
23.2 | 23.3 | 20.5 | 15.4 | 11.6 | 10.0 | 9.0 | 10.4 | 12.5 | 16.9 | 20.3 | 20.7 | 14.1 |
| Low Mn. Max (°C) |
14.7 | 12.4 | 12.1 | 9.5 | 7.8 | 5.6 | 5.3 | 5.3 | 7.7 | 8.3 | 11.1 | 12.8 | 11.0 |
| High Mn. Min (°C) |
8.5 | 9.0 | 7.7 | 5.3 | 3.9 | 2.7 | 2.6 | 2.7 | 3.4 | 4.7 | 5.9 | 7.5 | 3.9 |
| Low Mn. Min (°C) |
4.9 | 3.8 | 2.7 | 1.2 | 0.1 | -3.3 | -2.4 | -2.3 | -0.5 | 1.0 | 2.7 | 3.6 | 2.0 |
| High Rain (mm) |
224.0 | 193.0 | 215.0 | 344.9 | 537.2 | 548.6 | 388.6 | 449.7 | 451.8 | 566.6 | 384.3 | 267.2 | 2281.6 |
| Low Rain (mm) |
22.9 | 15.2 | 27.4 | 41.2 | 38.9 | 24.3 | 44.7 | 42.3 | 53.7 | 38.8 | 38.8 | 6.5 | 1087.7 |
Butlers Gorge Annual Temperatures & Rainfall
Butlers Gorge Average Number of Days With Temperatures
| Jan | Feb | Mar | Apr | May | Jun | Jul | Aug | Sep | Oct | Nov | Dec | Ann | |
|---|---|---|---|---|---|---|---|---|---|---|---|---|---|
| ≥ 40°C |
0.0 | 0.0 | 0.0 | 0.0 | 0.0 | 0.0 | 0.0 | 0.0 | 0.0 | 0.0 | 0.0 | 0.0 | 0.0 |
| ≥ 35°C |
0.0 | 0.0 | 0.0 | 0.0 | 0.0 | 0.0 | 0.0 | 0.0 | 0.0 | 0.0 | 0.0 | 0.0 | 0.0 |
| ≥ 30°C |
0.9 | 0.3 | 0.1 | 0.0 | 0.0 | 0.0 | 0.0 | 0.0 | 0.0 | 0.0 | 0.0 | 0.4 | 1.7 |
| ≤ 2°C |
2.8 | 3.6 | 5.8 | 10.8 | 16.6 | 21.1 | 24.2 | 23.6 | 19.1 | 14.3 | 8.5 | 4.4 | 153.7 |
| ≤ 0°C |
0.8 | 1.3 | 2.4 | 5.2 | 10.5 | 14.8 | 17.0 | 16.4 | 12.0 | 7.7 | 3.2 | 1.5 | 92.3 |
Butlers Gorge 'per Week' Values (14th/86th Percentiles)
| Jan | Feb | Mar | Apr | May | Jun | Jul | Aug | Sep | Oct | Nov | Dec | Ann | |
|---|---|---|---|---|---|---|---|---|---|---|---|---|---|
| High Max |
25.2 | 25.0 | 22.2 | 18.0 | 13.3 | 10.6 | 9.4 | 11.0 | 14.0 | 18.0 | 21.0 | 23.1 | 20.0 |
| Low Max |
12.0 | 12.8 | 11.1 | 8.9 | 6.9 | 5.0 | 4.4 | 5.0 | 6.5 | 7.6 | 9.0 | 10.6 | 7.0 |
| High Min |
9.5 | 9.8 | 8.5 | 7.2 | 5.5 | 4.0 | 2.8 | 3.1 | 4.0 | 5.5 | 7.5 | 8.9 | 7.2 |
| Low Min |
2.9 | 2.2 | 1.5 | 0.0 | -1.7 | -3.5 | -4.0 | -3.1 | -2.0 | -1.0 | 0.6 | 2.0 | -1.4 |
Butlers Gorge Data Availability
| Jan | Feb | Mar | Apr | May | Jun | Jul | Aug | Sep | Oct | Nov | Dec | Ann | |
|---|---|---|---|---|---|---|---|---|---|---|---|---|---|
| Years of Minima |
64 | 64 | 63 | 63 | 64 | 66 | 66 | 66 | 66 | 64 | 64 | 65 | 64.0 |
| Earliest Entry |
1945 | 1945 | 1945 | 1945 | 1945 | 1944 | 1944 | 1944 | 1944 | 1944 | 1944 | 1944 | 1944 |
| Latest Entry |
2024 | 2024 | 2024 | 2023 | 2023 | 2023 | 2023 | 2023 | 2023 | 2023 | 2023 | 2023 | 2024 |
| Years of Maxima |
64 | 64 | 63 | 62 | 64 | 65 | 63 | 66 | 66 | 64 | 64 | 65 | 64.0 |
| Earliest Entry |
1945 | 1945 | 1945 | 1945 | 1945 | 1944 | 1944 | 1944 | 1944 | 1944 | 1944 | 1944 | 1944 |
| Latest Entry |
2024 | 2024 | 2024 | 2023 | 2023 | 2023 | 2023 | 2023 | 2023 | 2023 | 2023 | 2023 | 2024 |
| Years of Rainfall |
72 | 71 | 71 | 72 | 71 | 72 | 72 | 72 | 73 | 73 | 73 | 73 | 70.0 |
| Earliest Entry |
1942 | 1942 | 1942 | 1942 | 1942 | 1942 | 1942 | 1942 | 1941 | 1941 | 1941 | 1941 | 1941 |
| Latest Entry |
2024 | 2024 | 2024 | 2023 | 2023 | 2023 | 2023 | 2023 | 2023 | 2023 | 2023 | 2023 | 2024 |
Station Details
BUTLERS GORGE
Central, Tasmania
Central, Tasmania
42.2753°S 146.2758°E
667m AMSL
Commenced 1941
Commenced 1941
Enter a postcode or town name for local weather, or text to search the site. » advanced search
Generation gone with the wind
13:20 AEST A weeklong stretch of low wind power was broken on Wednesday evening, as a weak cold front marched across southern Australia. The chart below shows that the National Electricity Market (NEM) has endured a weeklong stretch of low wind generation, with wind power providing around 6% of the NEM’s electricity, down from last year’s average of 13.1% (Mon, April 15 to Wed, April 17).
- 11:29 AEST Devilishly dry in Tasmania
- 16:41 AEST Dubai deluge: a year's rainfall in a day
- 11:37 AEST Melbourne weather strongly out of character
- 15:03 AEST BoM declares El Niño over