- WEATHER
Australia
- National
- New South Wales
- Victoria
- Queensland
- Western Australia
- South Australia
- Tasmania
- ACT
- Northern Territory
Long Range Forecasts
- WARNINGS
- RADAR
- SATELLITE
- MAPS & CHARTS
- LONG RANGE
Long Range Forecasts
- CLIMATE
Climate Indicators
- NEWS
South Australia Sea Surface Temperature Anomalies
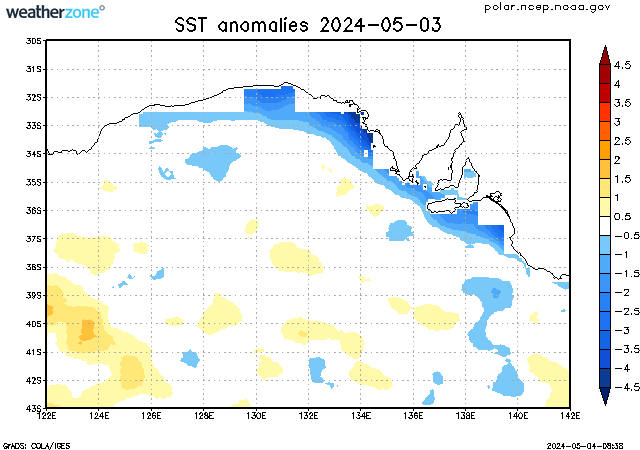
The sea surface temperature anomaly (SSTA) is the difference between the observed SST and the climatological SST. These anomalies are calculated on a weekly basis.
Positive SSTAs are usually correlated with increased regions of convection (cloudiness and rainfall) while negative SSTAs are usually correlated to reduced convection.
SSTAs can be used as an indicator of the phase of global climate fluctuations, such as the El Nino/Southern Oscillation (ENSO).
The data displayed in this map is the weekly average, centred on the date shown.
Enter a postcode or town name for local weather, or text to search the site. » advanced search
Generation gone with the wind
13:20 AEST A weeklong stretch of low wind power was broken on Wednesday evening, as a weak cold front marched across southern Australia. The chart below shows that the National Electricity Market (NEM) has endured a weeklong stretch of low wind generation, with wind power providing around 6% of the NEM’s electricity, down from last year’s average of 13.1% (Mon, April 15 to Wed, April 17).
- 11:29 AEST Devilishly dry in Tasmania
- 16:41 AEST Dubai deluge: a year's rainfall in a day
- 11:37 AEST Melbourne weather strongly out of character
- 15:03 AEST BoM declares El Niño over