- WEATHER
Australia
- National
- New South Wales
- Victoria
- Queensland
- Western Australia
- South Australia
- Tasmania
- ACT
- Northern Territory
Long Range Forecasts
- WARNINGS
- RADAR
- SATELLITE
- MAPS & CHARTS
- LONG RANGE
Long Range Forecasts
- CLIMATE
Climate Indicators
- NEWS
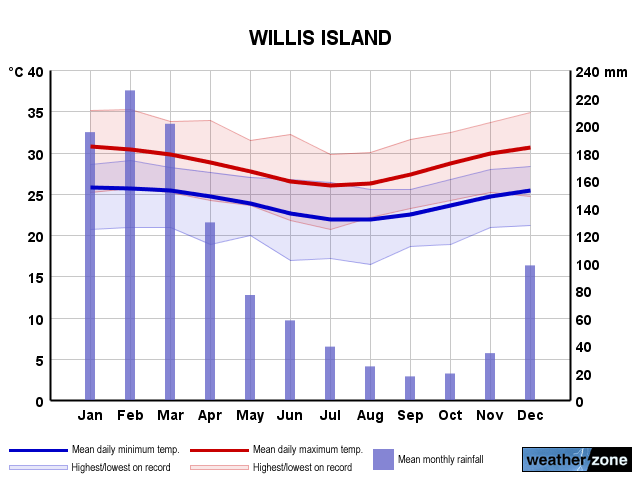
Willis Island Long-term Averages
| Jan | Feb | Mar | Apr | May | Jun | Jul | Aug | Sep | Oct | Nov | Dec | Ann | |
|---|---|---|---|---|---|---|---|---|---|---|---|---|---|
| Mean Max (°C) |
30.7 | 30.5 | 29.9 | 28.9 | 27.8 | 26.6 | 26.1 | 26.4 | 27.4 | 28.7 | 29.9 | 30.7 | 28.6 |
| Mean Min (°C) |
25.8 | 25.8 | 25.5 | 24.8 | 23.9 | 22.8 | 22.1 | 22.0 | 22.7 | 23.7 | 24.8 | 25.5 | 24.1 |
| Mean Rain (mm) |
185.0 | 205.7 | 199.5 | 126.0 | 72.1 | 53.0 | 41.1 | 22.1 | 14.7 | 20.5 | 36.4 | 100.2 | 1067.4 |
| Median Rain (mm) |
139.2 | 186.7 | 148.5 | 97.7 | 45.3 | 37.2 | 23.7 | 10.9 | 5.8 | 8.6 | 13.8 | 61.1 | 1053.7 |
| Mean Rain Days |
14.8 | 16.0 | 17.6 | 14.4 | 12.7 | 10.5 | 9.8 | 7.3 | 5.4 | 5.3 | 6.6 | 10.1 | 130.2 |
Willis Island Daily Records
| Jan | Feb | Mar | Apr | May | Jun | Jul | Aug | Sep | Oct | Nov | Dec | Ann | |
|---|---|---|---|---|---|---|---|---|---|---|---|---|---|
| High Max (°C) |
35.1 | 35.2 | 33.8 | 33.9 | 31.5 | 32.2 | 29.8 | 30.0 | 31.6 | 32.4 | 33.6 | 34.8 | 35.2 |
| Low Max (°C) |
25.1 | 25.6 | 25.1 | 24.2 | 23.6 | 21.9 | 20.7 | 22.1 | 23.2 | 24.2 | 25.1 | 24.7 | 20.7 |
| High Min (°C) |
28.9 | 29.2 | 28.5 | 27.6 | 27.1 | 26.4 | 26.4 | 25.6 | 26.0 | 27.0 | 27.9 | 28.3 | 29.2 |
| Low Min (°C) |
20.7 | 20.9 | 20.9 | 18.9 | 19.9 | 16.9 | 17.2 | 16.4 | 18.6 | 18.9 | 20.9 | 21.1 | 16.4 |
| High Rain (mm) |
294.8 | 329.2 | 335.8 | 229.9 | 246.4 | 178.2 | 162.0 | 116.8 | 72.6 | 121.9 | 119.6 | 170.9 | 335.8 |
Willis Island Monthly Records
| Jan | Feb | Mar | Apr | May | Jun | Jul | Aug | Sep | Oct | Nov | Dec | Ann | |
|---|---|---|---|---|---|---|---|---|---|---|---|---|---|
| High Mn. Max (°C) |
32.4 | 32.8 | 31.5 | 30.6 | 29.4 | 28.5 | 27.7 | 27.6 | 28.9 | 30.3 | 31.4 | 32.5 | 29.6 |
| Low Mn. Max (°C) |
28.9 | 28.7 | 27.5 | 27.6 | 26.4 | 25.2 | 23.8 | 24.1 | 25.5 | 27.0 | 28.6 | 28.9 | 27.5 |
| High Mn. Min (°C) |
26.9 | 27.6 | 26.7 | 26.3 | 25.6 | 24.3 | 23.8 | 23.6 | 24.8 | 25.5 | 26.3 | 27.0 | 25.3 |
| Low Mn. Min (°C) |
24.3 | 24.6 | 24.5 | 23.3 | 22.5 | 21.3 | 20.1 | 20.1 | 21.1 | 21.9 | 23.4 | 24.5 | 23.3 |
| High Rain (mm) |
633.2 | 684.5 | 1484.8 | 510.7 | 394.4 | 319.7 | 252.8 | 216.3 | 206.4 | 165.8 | 408.2 | 463.6 | 2482.4 |
| Low Rain (mm) |
10.7 | 10.0 | 7.2 | 10.8 | 0.0 | 0.0 | 0.0 | 0.0 | 0.0 | 0.0 | 1.0 | 0.0 | 240.6 |
Willis Island Annual Temperatures & Rainfall
Willis Island Average Number of Days With Temperatures
| Jan | Feb | Mar | Apr | May | Jun | Jul | Aug | Sep | Oct | Nov | Dec | Ann | |
|---|---|---|---|---|---|---|---|---|---|---|---|---|---|
| ≥ 40°C |
0.0 | 0.0 | 0.0 | 0.0 | 0.0 | 0.0 | 0.0 | 0.0 | 0.0 | 0.0 | 0.0 | 0.0 | 0.0 |
| ≥ 35°C |
0.0 | 0.0 | 0.0 | 0.0 | 0.0 | 0.0 | 0.0 | 0.0 | 0.0 | 0.0 | 0.0 | 0.0 | 0.0 |
| ≥ 30°C |
23.7 | 19.9 | 15.3 | 4.0 | 0.5 | 0.0 | 0.0 | 0.0 | 0.2 | 4.1 | 14.3 | 23.8 | 105.8 |
| ≤ 2°C |
0.0 | 0.0 | 0.0 | 0.0 | 0.0 | 0.0 | 0.0 | 0.0 | 0.0 | 0.0 | 0.0 | 0.0 | 0.0 |
| ≤ 0°C |
0.0 | 0.0 | 0.0 | 0.0 | 0.0 | 0.0 | 0.0 | 0.0 | 0.0 | 0.0 | 0.0 | 0.0 | 0.0 |
Willis Island 'per Week' Values (14th/86th Percentiles)
| Jan | Feb | Mar | Apr | May | Jun | Jul | Aug | Sep | Oct | Nov | Dec | Ann | |
|---|---|---|---|---|---|---|---|---|---|---|---|---|---|
| High Max |
32.0 | 31.7 | 30.9 | 29.8 | 28.8 | 27.7 | 27.1 | 27.5 | 28.4 | 29.9 | 31.0 | 31.8 | 30.8 |
| Low Max |
29.4 | 29.1 | 28.9 | 27.8 | 26.7 | 25.3 | 24.8 | 25.2 | 26.2 | 27.6 | 28.8 | 29.5 | 26.3 |
| High Min |
26.9 | 26.9 | 26.6 | 25.8 | 25.0 | 23.9 | 23.2 | 23.1 | 23.7 | 24.8 | 25.7 | 26.5 | 26.1 |
| Low Min |
24.4 | 24.4 | 24.2 | 23.6 | 22.6 | 21.3 | 20.6 | 20.7 | 21.5 | 22.5 | 23.6 | 24.3 | 22.0 |
Willis Island Data Availability
| Jan | Feb | Mar | Apr | May | Jun | Jul | Aug | Sep | Oct | Nov | Dec | Ann | |
|---|---|---|---|---|---|---|---|---|---|---|---|---|---|
| Years of Minima |
99 | 98 | 98 | 96 | 93 | 92 | 93 | 94 | 94 | 94 | 95 | 96 | 93.0 |
| Earliest Entry |
1922 | 1922 | 1922 | 1922 | 1923 | 1923 | 1923 | 1922 | 1922 | 1922 | 1921 | 1921 | 1921 |
| Latest Entry |
2024 | 2024 | 2024 | 2023 | 2023 | 2023 | 2023 | 2023 | 2023 | 2023 | 2023 | 2023 | 2024 |
| Years of Maxima |
99 | 98 | 98 | 98 | 94 | 93 | 94 | 94 | 94 | 94 | 96 | 96 | 94.0 |
| Earliest Entry |
1922 | 1922 | 1922 | 1922 | 1922 | 1922 | 1922 | 1922 | 1922 | 1922 | 1921 | 1921 | 1921 |
| Latest Entry |
2024 | 2024 | 2024 | 2023 | 2023 | 2023 | 2023 | 2023 | 2023 | 2023 | 2023 | 2023 | 2024 |
| Years of Rainfall |
92 | 92 | 93 | 92 | 92 | 91 | 90 | 90 | 89 | 90 | 92 | 92 | 90.0 |
| Earliest Entry |
1922 | 1922 | 1922 | 1922 | 1922 | 1922 | 1922 | 1922 | 1922 | 1922 | 1921 | 1921 | 1921 |
| Latest Entry |
2024 | 2024 | 2024 | 2023 | 2023 | 2023 | 2023 | 2023 | 2023 | 2023 | 2023 | 2023 | 2024 |
Station Details
WILLIS ISLAND
Central Coast, Queensland
Central Coast, Queensland
16.2878°S 149.9652°E
10m AMSL
Commenced 1921
Commenced 1921
Enter a postcode or town name for local weather, or text to search the site. » advanced search
Generation gone with the wind
13:20 AEST A weeklong stretch of low wind power was broken on Wednesday evening, as a weak cold front marched across southern Australia. The chart below shows that the National Electricity Market (NEM) has endured a weeklong stretch of low wind generation, with wind power providing around 6% of the NEM’s electricity, down from last year’s average of 13.1% (Mon, April 15 to Wed, April 17).
- 11:29 AEST Devilishly dry in Tasmania
- 16:41 AEST Dubai deluge: a year's rainfall in a day
- 11:37 AEST Melbourne weather strongly out of character
- 15:03 AEST BoM declares El Niño over