- WEATHER
Australia
- National
- New South Wales
- Victoria
- Queensland
- Western Australia
- South Australia
- Tasmania
- ACT
- Northern Territory
Long Range Forecasts
- WARNINGS
- RADAR
- SATELLITE
- MAPS & CHARTS
- LONG RANGE
Long Range Forecasts
- CLIMATE
Climate Indicators
- NEWS
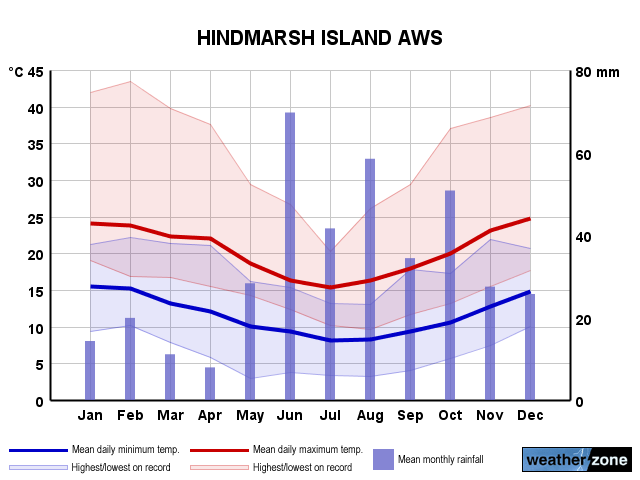
Hindmarsh Is Long-term Averages
| Jan | Feb | Mar | Apr | May | Jun | Jul | Aug | Sep | Oct | Nov | Dec | Ann | |
|---|---|---|---|---|---|---|---|---|---|---|---|---|---|
| Mean Max (°C) |
25.6 | 24.7 | 24.0 | 21.8 | 18.5 | 15.9 | 15.4 | 16.4 | 18.7 | 21.0 | 23.1 | 24.6 | 20.7 |
| Mean Min (°C) |
16.2 | 15.9 | 14.6 | 12.5 | 10.5 | 8.6 | 8.1 | 8.3 | 9.4 | 10.9 | 13.1 | 14.6 | 11.8 |
| Mean Rain (mm) |
18.3 | 16.1 | 14.9 | 28.4 | 45.9 | 56.3 | 49.0 | 48.4 | 41.0 | 29.1 | 24.5 | 24.5 | 396.0 |
| Median Rain (mm) |
12.2 | 8.8 | 14.2 | 24.8 | 28.6 | 45.2 | 31.8 | 47.4 | 34.6 | 22.3 | 21.8 | 25.2 | 383.4 |
| Mean Rain Days |
5.0 | 5.3 | 7.0 | 11.0 | 15.5 | 18.1 | 17.9 | 17.4 | 14.5 | 10.0 | 8.3 | 7.4 | 137.2 |
Hindmarsh Is Daily Records
| Jan | Feb | Mar | Apr | May | Jun | Jul | Aug | Sep | Oct | Nov | Dec | Ann | |
|---|---|---|---|---|---|---|---|---|---|---|---|---|---|
| High Max (°C) |
46.8 | 44.1 | 41.8 | 37.6 | 30.4 | 26.7 | 23.5 | 29.9 | 32.1 | 38.4 | 41.8 | 45.2 | 46.8 |
| Low Max (°C) |
17.5 | 16.8 | 16.4 | 13.4 | 12.1 | 11.1 | 9.0 | 9.6 | 11.3 | 13.2 | 14.7 | 15.5 | 9.0 |
| High Min (°C) |
27.8 | 27.4 | 25.7 | 21.1 | 16.8 | 15.3 | 13.8 | 14.5 | 21.0 | 18.9 | 22.0 | 23.7 | 27.8 |
| Low Min (°C) |
8.3 | 7.9 | 7.7 | 5.8 | 0.9 | 0.3 | -0.1 | 2.1 | 1.4 | 4.8 | 5.2 | 7.6 | -0.1 |
| High Rain (mm) |
29.2 | 61.4 | 22.2 | 32.8 | 36.8 | 43.6 | 25.0 | 23.2 | 44.4 | 29.0 | 34.4 | 47.0 | 61.4 |
Hindmarsh Is Monthly Records
| Jan | Feb | Mar | Apr | May | Jun | Jul | Aug | Sep | Oct | Nov | Dec | Ann | |
|---|---|---|---|---|---|---|---|---|---|---|---|---|---|
| High Mn. Max (°C) |
28.1 | 27.0 | 28.1 | 24.4 | 20.5 | 17.0 | 16.7 | 18.1 | 21.2 | 23.9 | 27.1 | 29.0 | 21.5 |
| Low Mn. Max (°C) |
21.4 | 22.4 | 21.3 | 18.5 | 16.7 | 14.0 | 14.4 | 14.4 | 15.5 | 17.6 | 19.2 | 21.9 | 19.1 |
| High Mn. Min (°C) |
18.1 | 16.9 | 16.3 | 13.8 | 12.2 | 10.1 | 9.3 | 9.5 | 11.4 | 12.2 | 15.4 | 15.7 | 12.3 |
| Low Mn. Min (°C) |
14.4 | 14.7 | 13.0 | 10.8 | 8.9 | 6.1 | 7.3 | 7.1 | 8.1 | 9.7 | 11.8 | 13.5 | 10.7 |
| High Rain (mm) |
44.4 | 69.4 | 47.6 | 82.4 | 99.0 | 128.0 | 84.2 | 91.6 | 117.8 | 70.8 | 74.0 | 82.0 | 522.4 |
| Low Rain (mm) |
0.2 | 0.0 | 0.6 | 5.6 | 10.2 | 17.6 | 25.4 | 6.6 | 18.6 | 2.6 | 6.6 | 1.4 | 244.4 |
Hindmarsh Is Annual Temperatures & Rainfall
Hindmarsh Is Average Number of Days With Temperatures
| Jan | Feb | Mar | Apr | May | Jun | Jul | Aug | Sep | Oct | Nov | Dec | Ann | |
|---|---|---|---|---|---|---|---|---|---|---|---|---|---|
| ≥ 40°C |
1.8 | 0.5 | 0.2 | 0.0 | 0.0 | 0.0 | 0.0 | 0.0 | 0.0 | 0.0 | 0.1 | 0.8 | 3.4 |
| ≥ 35°C |
4.2 | 2.6 | 1.8 | 0.3 | 0.0 | 0.0 | 0.0 | 0.0 | 0.0 | 0.6 | 1.8 | 3.3 | 14.2 |
| ≥ 30°C |
6.3 | 4.8 | 5.0 | 2.1 | 0.0 | 0.0 | 0.0 | 0.0 | 0.2 | 2.7 | 5.7 | 5.6 | 31.8 |
| ≤ 2°C |
0.0 | 0.0 | 0.0 | 0.0 | 0.0 | 0.3 | 0.3 | 0.0 | 0.0 | 0.0 | 0.0 | 0.0 | 0.7 |
| ≤ 0°C |
0.0 | 0.0 | 0.0 | 0.0 | 0.0 | 0.0 | 0.0 | 0.0 | 0.0 | 0.0 | 0.0 | 0.0 | 0.0 |
Hindmarsh Is 'per Week' Values (14th/86th Percentiles)
| Jan | Feb | Mar | Apr | May | Jun | Jul | Aug | Sep | Oct | Nov | Dec | Ann | |
|---|---|---|---|---|---|---|---|---|---|---|---|---|---|
| High Max |
32.1 | 31.6 | 33.5 | 26.8 | 21.4 | 17.8 | 17.3 | 20.3 | 23.3 | 28.0 | 32.5 | 33.1 | 26.4 |
| Low Max |
20.3 | 19.9 | 18.9 | 17.5 | 15.7 | 13.8 | 13.0 | 13.5 | 14.5 | 15.8 | 17.5 | 19.4 | 15.0 |
| High Min |
18.4 | 18.2 | 17.1 | 15.1 | 13.2 | 11.3 | 10.0 | 10.4 | 11.9 | 13.2 | 15.8 | 16.8 | 15.9 |
| Low Min |
13.0 | 12.9 | 10.7 | 9.0 | 6.8 | 5.3 | 5.4 | 5.8 | 6.3 | 7.1 | 10.2 | 11.8 | 7.2 |
Hindmarsh Is Data Availability
| Jan | Feb | Mar | Apr | May | Jun | Jul | Aug | Sep | Oct | Nov | Dec | Ann | |
|---|---|---|---|---|---|---|---|---|---|---|---|---|---|
| Years of Minima |
20 | 20 | 20 | 21 | 21 | 21 | 21 | 21 | 21 | 21 | 21 | 20 | 21.0 |
| Earliest Entry |
2003 | 2003 | 2003 | 2003 | 2003 | 2003 | 2003 | 2003 | 2003 | 2003 | 2003 | 2003 | 2003 |
| Latest Entry |
2024 | 2024 | 2024 | 2023 | 2023 | 2023 | 2023 | 2023 | 2023 | 2023 | 2023 | 2023 | 2024 |
| Years of Maxima |
20 | 20 | 20 | 21 | 21 | 21 | 21 | 21 | 20 | 21 | 21 | 20 | 21.0 |
| Earliest Entry |
2003 | 2003 | 2003 | 2003 | 2003 | 2003 | 2003 | 2003 | 2003 | 2003 | 2003 | 2003 | 2003 |
| Latest Entry |
2024 | 2024 | 2024 | 2023 | 2023 | 2023 | 2023 | 2023 | 2023 | 2023 | 2023 | 2023 | 2024 |
| Years of Rainfall |
21 | 22 | 21 | 21 | 21 | 21 | 21 | 21 | 21 | 21 | 21 | 20 | 21.0 |
| Earliest Entry |
2003 | 2003 | 2003 | 2003 | 2003 | 2003 | 2003 | 2003 | 2003 | 2003 | 2003 | 2003 | 2003 |
| Latest Entry |
2024 | 2024 | 2024 | 2023 | 2023 | 2023 | 2023 | 2023 | 2023 | 2023 | 2023 | 2023 | 2024 |
Station Details
HINDMARSH ISLAND AWS
Mount Lofty Ranges, South Australia
Mount Lofty Ranges, South Australia
35.5194°S 138.8177°E
11m AMSL
Commenced 2003
Commenced 2003
Enter a postcode or town name for local weather, or text to search the site. » advanced search
A very wet weekend for southeast Qld, northeast NSW
11:48 AEST A prolonged rainfall event is set to bring large totals to parts of NSW and Qld from Saturday, with possible heavy falls and flooding. A low-pressure system in the Coral Sea, a deepening coastal trough and persistent easterlies will bring moisture-laden air into southeast Qld and northeast NSW will bring days of rainfall to the region. While there is not a drop of rain on the radar over southeast Qld and Northeast NSW on Friday morning, the mass of cloud associated with a low in the Coral Sea will enhance rainfall over the weekend.
- 10:07 AEST Southerly surges across the southeast
- 13:20 AEST Generation gone with the wind
- 11:29 AEST Devilishly dry in Tasmania
- 16:41 AEST Dubai deluge: a year's rainfall in a day