- WEATHER
Australia
- National
- New South Wales
- Victoria
- Queensland
- Western Australia
- South Australia
- Tasmania
- ACT
- Northern Territory
Long Range Forecasts
- WARNINGS
- RADAR
- SATELLITE
- MAPS & CHARTS
- LONG RANGE
Long Range Forecasts
- CLIMATE
Climate Indicators
- NEWS
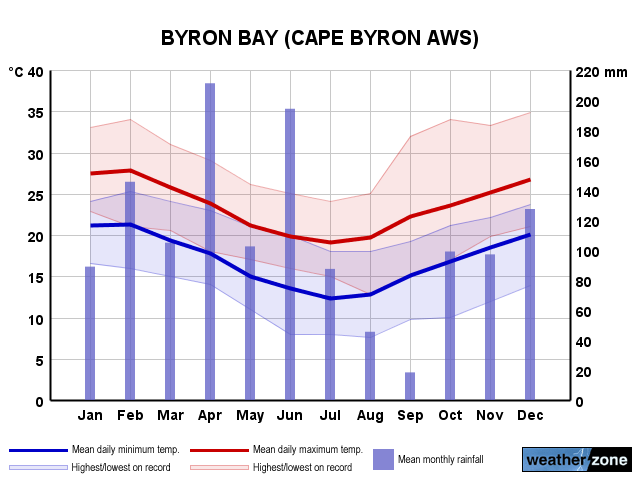
Cape Byron Long-term Averages
| Jan | Feb | Mar | Apr | May | Jun | Jul | Aug | Sep | Oct | Nov | Dec | Ann | |
|---|---|---|---|---|---|---|---|---|---|---|---|---|---|
| Mean Max (°C) |
28.0 | 27.5 | 26.5 | 24.1 | 21.4 | 19.4 | 19.0 | 20.2 | 22.0 | 23.7 | 25.4 | 26.7 | 23.6 |
| Mean Min (°C) |
21.3 | 21.2 | 20.1 | 17.8 | 15.1 | 13.2 | 12.4 | 13.1 | 15.3 | 17.0 | 18.6 | 20.0 | 17.0 |
| Mean Rain (mm) |
150.7 | 205.4 | 188.5 | 160.0 | 104.5 | 150.8 | 84.1 | 64.3 | 52.8 | 94.1 | 99.5 | 132.8 | 1468.1 |
| Median Rain (mm) |
97.6 | 160.6 | 77.6 | 127.8 | 112.6 | 152.6 | 69.8 | 27.0 | 33.8 | 60.1 | 78.8 | 103.2 | 1394.6 |
| Mean Rain Days |
15.2 | 15.8 | 17.6 | 15.5 | 13.9 | 13.1 | 11.2 | 8.3 | 9.1 | 12.7 | 12.0 | 14.2 | 157.1 |
Cape Byron Daily Records
| Jan | Feb | Mar | Apr | May | Jun | Jul | Aug | Sep | Oct | Nov | Dec | Ann | |
|---|---|---|---|---|---|---|---|---|---|---|---|---|---|
| High Max (°C) |
34.0 | 34.0 | 32.8 | 29.8 | 26.9 | 25.0 | 27.1 | 28.3 | 32.0 | 34.0 | 33.3 | 34.8 | 34.8 |
| Low Max (°C) |
21.6 | 20.6 | 20.6 | 16.9 | 15.2 | 12.1 | 13.1 | 12.8 | 15.0 | 16.2 | 18.5 | 19.2 | 12.1 |
| High Min (°C) |
25.6 | 25.8 | 24.9 | 23.6 | 21.7 | 20.0 | 19.2 | 19.1 | 20.7 | 21.8 | 22.7 | 23.9 | 25.8 |
| Low Min (°C) |
16.5 | 16.0 | 14.7 | 10.9 | 9.0 | 6.5 | 7.1 | 6.6 | 9.7 | 9.5 | 11.8 | 13.9 | 6.5 |
| High Rain (mm) |
134.2 | 275.4 | 164.2 | 146.4 | 89.8 | 177.6 | 91.4 | 93.2 | 71.2 | 204.8 | 92.4 | 79.2 | 275.4 |
Cape Byron Monthly Records
| Jan | Feb | Mar | Apr | May | Jun | Jul | Aug | Sep | Oct | Nov | Dec | Ann | |
|---|---|---|---|---|---|---|---|---|---|---|---|---|---|
| High Mn. Max (°C) |
30.5 | 28.8 | 28.1 | 25.3 | 23.4 | 20.4 | 20.0 | 21.5 | 23.6 | 24.8 | 26.9 | 28.9 | 24.6 |
| Low Mn. Max (°C) |
26.5 | 25.9 | 24.8 | 22.2 | 20.2 | 18.4 | 17.8 | 18.5 | 20.7 | 22.6 | 24.0 | 24.5 | 22.6 |
| High Mn. Min (°C) |
22.7 | 22.4 | 21.3 | 18.9 | 17.1 | 14.3 | 13.6 | 14.6 | 16.8 | 18.1 | 19.8 | 21.2 | 17.6 |
| Low Mn. Min (°C) |
20.2 | 19.9 | 18.7 | 15.6 | 13.7 | 12.1 | 10.9 | 11.6 | 13.7 | 15.4 | 17.2 | 18.0 | 16.2 |
| High Rain (mm) |
443.6 | 771.6 | 629.2 | 395.6 | 206.6 | 367.4 | 168.2 | 302.8 | 199.0 | 368.8 | 230.8 | 463.8 | 2333.0 |
| Low Rain (mm) |
3.0 | 25.8 | 0.0 | 38.8 | 9.6 | 1.8 | 9.6 | 2.4 | 0.2 | 8.6 | 11.6 | 24.6 | 766.2 |
Cape Byron Annual Temperatures & Rainfall
Cape Byron Average Number of Days With Temperatures
| Jan | Feb | Mar | Apr | May | Jun | Jul | Aug | Sep | Oct | Nov | Dec | Ann | |
|---|---|---|---|---|---|---|---|---|---|---|---|---|---|
| ≥ 40°C |
0.0 | 0.0 | 0.0 | 0.0 | 0.0 | 0.0 | 0.0 | 0.0 | 0.0 | 0.0 | 0.0 | 0.0 | 0.0 |
| ≥ 35°C |
0.0 | 0.0 | 0.0 | 0.0 | 0.0 | 0.0 | 0.0 | 0.0 | 0.0 | 0.0 | 0.0 | 0.0 | 0.0 |
| ≥ 30°C |
7.3 | 4.6 | 2.2 | 0.0 | 0.0 | 0.0 | 0.0 | 0.0 | 0.1 | 0.2 | 0.7 | 3.8 | 18.9 |
| ≤ 2°C |
0.0 | 0.0 | 0.0 | 0.0 | 0.0 | 0.0 | 0.0 | 0.0 | 0.0 | 0.0 | 0.0 | 0.0 | 0.0 |
| ≤ 0°C |
0.0 | 0.0 | 0.0 | 0.0 | 0.0 | 0.0 | 0.0 | 0.0 | 0.0 | 0.0 | 0.0 | 0.0 | 0.0 |
Cape Byron 'per Week' Values (14th/86th Percentiles)
| Jan | Feb | Mar | Apr | May | Jun | Jul | Aug | Sep | Oct | Nov | Dec | Ann | |
|---|---|---|---|---|---|---|---|---|---|---|---|---|---|
| High Max |
30.3 | 30.0 | 28.9 | 26.1 | 23.4 | 21.6 | 21.3 | 22.5 | 24.7 | 26.2 | 27.9 | 29.3 | 28.0 |
| Low Max |
25.1 | 24.9 | 23.7 | 21.0 | 19.4 | 17.3 | 16.6 | 17.2 | 19.2 | 21.0 | 21.9 | 23.9 | 19.0 |
| High Min |
23.0 | 22.9 | 21.9 | 19.6 | 17.0 | 15.4 | 14.1 | 15.6 | 18.1 | 18.9 | 20.4 | 22.0 | 21.0 |
| Low Min |
19.0 | 19.3 | 17.8 | 15.1 | 13.0 | 10.9 | 9.8 | 10.4 | 12.8 | 14.5 | 15.9 | 18.0 | 12.5 |
Cape Byron Data Availability
| Jan | Feb | Mar | Apr | May | Jun | Jul | Aug | Sep | Oct | Nov | Dec | Ann | |
|---|---|---|---|---|---|---|---|---|---|---|---|---|---|
| Years of Minima |
22 | 22 | 21 | 20 | 21 | 21 | 21 | 20 | 21 | 20 | 20 | 20 | 21.0 |
| Earliest Entry |
2003 | 2003 | 2003 | 2003 | 2003 | 2003 | 2003 | 2003 | 2003 | 2003 | 2002 | 2002 | 2002 |
| Latest Entry |
2024 | 2024 | 2024 | 2023 | 2023 | 2023 | 2023 | 2023 | 2023 | 2023 | 2023 | 2023 | 2024 |
| Years of Maxima |
22 | 22 | 21 | 20 | 21 | 21 | 21 | 20 | 21 | 20 | 20 | 20 | 21.0 |
| Earliest Entry |
2003 | 2003 | 2003 | 2003 | 2003 | 2003 | 2003 | 2003 | 2003 | 2003 | 2002 | 2002 | 2002 |
| Latest Entry |
2024 | 2024 | 2024 | 2023 | 2023 | 2023 | 2023 | 2023 | 2023 | 2023 | 2023 | 2023 | 2024 |
| Years of Rainfall |
22 | 22 | 21 | 20 | 21 | 21 | 21 | 21 | 21 | 21 | 20 | 20 | 21.0 |
| Earliest Entry |
2003 | 2003 | 2003 | 2003 | 2003 | 2003 | 2003 | 2003 | 2003 | 2003 | 2002 | 2002 | 2002 |
| Latest Entry |
2024 | 2024 | 2024 | 2023 | 2023 | 2023 | 2023 | 2023 | 2023 | 2023 | 2023 | 2023 | 2024 |
Station Details
BYRON BAY (CAPE BYRON AWS)
Northern Rivers, New South Wales/ACT
Northern Rivers, New South Wales/ACT
28.6399°S 153.6358°E
95m AMSL
Commenced 1994
Commenced 1994
Enter a postcode or town name for local weather, or text to search the site. » advanced search
A very wet weekend for southeast Qld, northeast NSW
11:48 AEST A prolonged rainfall event is set to bring large totals to parts of NSW and Qld from Saturday, with possible heavy falls and flooding. A low-pressure system in the Coral Sea, a deepening coastal trough and persistent easterlies will bring moisture-laden air into southeast Qld and northeast NSW will bring days of rainfall to the region. While there is not a drop of rain on the radar over southeast Qld and Northeast NSW on Friday morning, the mass of cloud associated with a low in the Coral Sea will enhance rainfall over the weekend.
- 10:07 AEST Southerly surges across the southeast
- 13:20 AEST Generation gone with the wind
- 11:29 AEST Devilishly dry in Tasmania
- 16:41 AEST Dubai deluge: a year's rainfall in a day