- WEATHER
Australia
- National
- New South Wales
- Victoria
- Queensland
- Western Australia
- South Australia
- Tasmania
- ACT
- Northern Territory
Long Range Forecasts
- WARNINGS
- RADAR
- SATELLITE
- MAPS & CHARTS
- LONG RANGE
Long Range Forecasts
- CLIMATE
Climate Indicators
- NEWS
Australia Sea Surface Temperature Anomalies
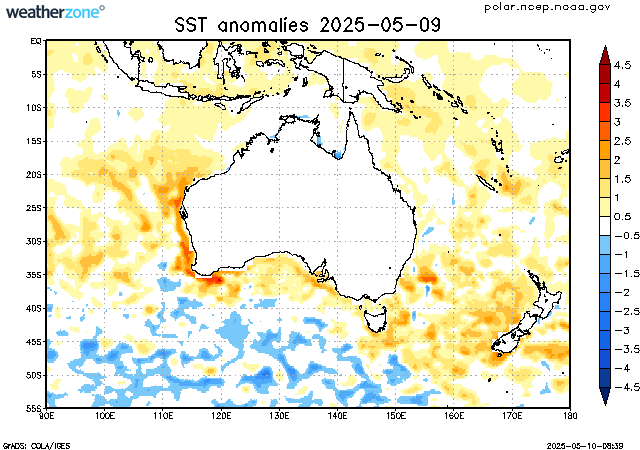
The sea surface temperature anomaly (SSTA) is the difference between the observed SST and the climatological SST. These anomalies are calculated on a weekly basis.
Positive SSTAs are usually correlated with increased regions of convection (cloudiness and rainfall) while negative SSTAs are usually correlated to reduced convection.
SSTAs can be used as an indicator of the phase of global climate fluctuations, such as the El Nino/Southern Oscillation (ENSO).
The data displayed in this map is the weekly average, centred on the date shown.
Enter a postcode or town name for local weather, or text to search the site. » advanced search
Signs indicating Australia's cool season arrival
16:15 AEST Mere hours after our Total Lightning Network went quiet over the Australian continent, the Himawari satellite captured a clear, textbook snapshot of the arrival of Australia's cool season. A few distinguishing features should catch your eye: A band of cloud streaming over northern WA and towards the nation's interior A distinct clearing of cloud from most of the NT's Top End, and A band of cloud crossing to the south of WA Turns out, all three of these features point to one thing: winter is knocking at the door. Image: Himawari satellite imagery and mean sea level pressure (ECMWF) over Australia on the morning of Saturday, April 27th, 2024.