- WEATHER
Australia
- National
- New South Wales
- Victoria
- Queensland
- Western Australia
- South Australia
- Tasmania
- ACT
- Northern Territory
Long Range Forecasts
- WARNINGS
- RADAR
- SATELLITE
- MAPS & CHARTS
- LONG RANGE
Long Range Forecasts
- CLIMATE
Climate Indicators
- NEWS
Goulburn Long-term Averages
| Jan | Feb | Mar | Apr | May | Jun | Jul | Aug | Sep | Oct | Nov | Dec | Ann | |
|---|---|---|---|---|---|---|---|---|---|---|---|---|---|
| Mean Max (°C) |
27.9 | 26.4 | 23.9 | 20.0 | 15.8 | 12.3 | 11.6 | 13.2 | 16.6 | 19.9 | 22.9 | 25.9 | 19.6 |
| Mean Min (°C) |
14.0 | 13.7 | 11.4 | 7.9 | 4.6 | 2.7 | 1.6 | 2.3 | 4.7 | 7.1 | 9.7 | 12.0 | 7.6 |
| Mean Rain (mm) |
65.1 | 62.0 | 61.9 | 45.5 | 41.1 | 51.7 | 39.9 | 54.8 | 47.5 | 52.8 | 67.3 | 61.9 | 645.6 |
| Median Rain (mm) |
55.0 | 48.7 | 46.0 | 26.2 | 36.3 | 36.2 | 41.3 | 40.8 | 46.3 | 50.0 | 66.2 | 46.6 | 627.9 |
| Mean Rain Days |
10.1 | 10.0 | 11.4 | 11.0 | 12.9 | 16.3 | 16.4 | 14.5 | 11.2 | 11.2 | 11.2 | 9.8 | 145.8 |
Goulburn Daily Records
| Jan | Feb | Mar | Apr | May | Jun | Jul | Aug | Sep | Oct | Nov | Dec | Ann | |
|---|---|---|---|---|---|---|---|---|---|---|---|---|---|
| High Max (°C) |
41.7 | 41.2 | 37.2 | 32.6 | 25.0 | 21.0 | 19.0 | 24.0 | 30.3 | 32.7 | 40.1 | 41.4 | 41.7 |
| Low Max (°C) |
13.9 | 13.7 | 12.7 | 8.5 | 5.2 | 3.9 | 4.2 | 4.6 | 7.0 | 8.5 | 9.1 | 12.0 | 3.9 |
| High Min (°C) |
26.2 | 27.5 | 22.0 | 20.1 | 14.9 | 12.4 | 11.4 | 12.5 | 16.6 | 20.0 | 24.4 | 23.5 | 27.5 |
| Low Min (°C) |
3.8 | 3.3 | -0.6 | -4.4 | -5.5 | -7.4 | -8.5 | -6.8 | -6.0 | -2.0 | -0.5 | 0.9 | -8.5 |
| High Rain (mm) |
148.2 | 73.4 | 93.4 | 92.0 | 61.2 | 114.0 | 40.4 | 99.2 | 35.2 | 51.6 | 63.8 | 90.0 | 148.2 |
Goulburn Monthly Records
| Jan | Feb | Mar | Apr | May | Jun | Jul | Aug | Sep | Oct | Nov | Dec | Ann | |
|---|---|---|---|---|---|---|---|---|---|---|---|---|---|
| High Mn. Max (°C) |
32.5 | 30.1 | 27.7 | 24.0 | 18.5 | 14.6 | 13.7 | 16.8 | 20.2 | 23.5 | 28.4 | 30.3 | 21.3 |
| Low Mn. Max (°C) |
22.6 | 22.7 | 21.0 | 17.6 | 13.9 | 10.2 | 9.7 | 10.9 | 13.5 | 16.8 | 18.7 | 21.9 | 17.4 |
| High Mn. Min (°C) |
18.0 | 15.9 | 13.7 | 11.4 | 7.9 | 6.4 | 4.2 | 5.4 | 6.7 | 10.0 | 12.4 | 14.8 | 8.9 |
| Low Mn. Min (°C) |
11.1 | 10.9 | 8.6 | 5.1 | 2.1 | -0.9 | -1.7 | 0.0 | 2.2 | 4.5 | 7.1 | 8.4 | 5.7 |
| High Rain (mm) |
214.0 | 167.0 | 180.8 | 208.2 | 124.6 | 191.2 | 97.2 | 215.0 | 101.6 | 148.4 | 208.0 | 228.4 | 1049.3 |
| Low Rain (mm) |
3.0 | 2.5 | 2.4 | 0.2 | 2.6 | 9.4 | 4.0 | 5.2 | 4.4 | 0.0 | 4.6 | 0.8 | 362.0 |
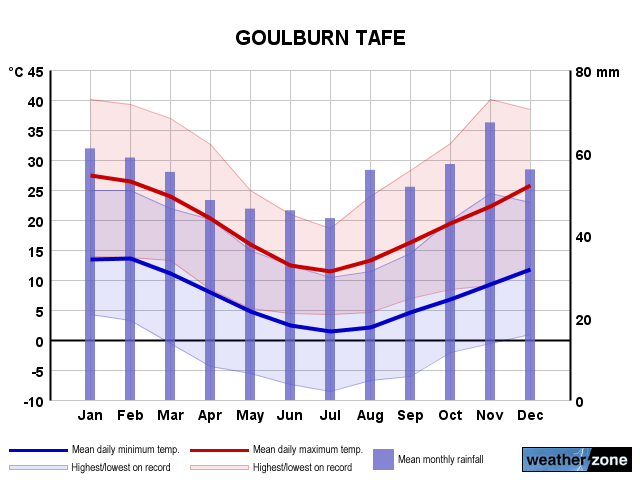
Goulburn Annual Temperatures & Rainfall
Goulburn Average Number of Days With Temperatures
| Jan | Feb | Mar | Apr | May | Jun | Jul | Aug | Sep | Oct | Nov | Dec | Ann | |
|---|---|---|---|---|---|---|---|---|---|---|---|---|---|
| ≥ 40°C |
0.2 | 0.0 | 0.0 | 0.0 | 0.0 | 0.0 | 0.0 | 0.0 | 0.0 | 0.0 | 0.0 | 0.0 | 0.2 |
| ≥ 35°C |
3.6 | 1.7 | 0.2 | 0.0 | 0.0 | 0.0 | 0.0 | 0.0 | 0.0 | 0.0 | 0.4 | 1.1 | 6.7 |
| ≥ 30°C |
11.6 | 6.9 | 3.1 | 0.2 | 0.0 | 0.0 | 0.0 | 0.0 | 0.0 | 0.4 | 2.9 | 7.1 | 31.1 |
| ≤ 2°C |
0.0 | 0.0 | 0.2 | 2.1 | 8.7 | 12.9 | 16.6 | 13.8 | 7.1 | 2.7 | 0.6 | 0.1 | 64.0 |
| ≤ 0°C |
0.0 | 0.0 | 0.0 | 0.7 | 4.1 | 7.9 | 10.5 | 8.7 | 3.1 | 0.8 | 0.0 | 0.0 | 35.2 |
Goulburn 'per Week' Values (14th/86th Percentiles)
| Jan | Feb | Mar | Apr | May | Jun | Jul | Aug | Sep | Oct | Nov | Dec | Ann | |
|---|---|---|---|---|---|---|---|---|---|---|---|---|---|
| High Max |
34.0 | 32.4 | 29.2 | 24.2 | 19.5 | 15.2 | 14.2 | 16.7 | 21.1 | 24.5 | 28.6 | 31.6 | 27.5 |
| Low Max |
21.6 | 20.7 | 19.1 | 16.0 | 12.7 | 9.5 | 8.8 | 9.9 | 12.1 | 14.9 | 16.7 | 20.2 | 11.8 |
| High Min |
16.8 | 16.6 | 14.8 | 11.9 | 9.2 | 6.7 | 5.4 | 6.0 | 8.5 | 11.0 | 13.4 | 15.2 | 13.6 |
| Low Min |
10.0 | 10.3 | 7.1 | 3.5 | 0.2 | -1.9 | -2.5 | -2.0 | 0.5 | 2.6 | 5.2 | 7.9 | 1.0 |
Goulburn Data Availability
| Jan | Feb | Mar | Apr | May | Jun | Jul | Aug | Sep | Oct | Nov | Dec | Ann | |
|---|---|---|---|---|---|---|---|---|---|---|---|---|---|
| Years of Minima |
45 | 46 | 47 | 48 | 47 | 48 | 49 | 49 | 47 | 48 | 49 | 48 | 46.0 |
| Earliest Entry |
1972 | 1972 | 1972 | 1972 | 1972 | 1972 | 1972 | 1972 | 1971 | 1971 | 1971 | 1971 | 1971 |
| Latest Entry |
2024 | 2024 | 2024 | 2024 | 2024 | 2023 | 2023 | 2023 | 2023 | 2023 | 2023 | 2023 | 2024 |
| Years of Maxima |
46 | 47 | 48 | 49 | 48 | 49 | 49 | 49 | 47 | 49 | 48 | 47 | 48.0 |
| Earliest Entry |
1972 | 1972 | 1972 | 1972 | 1972 | 1972 | 1972 | 1972 | 1971 | 1971 | 1971 | 1971 | 1971 |
| Latest Entry |
2024 | 2024 | 2024 | 2024 | 2024 | 2023 | 2023 | 2023 | 2023 | 2023 | 2023 | 2023 | 2024 |
| Years of Rainfall |
49 | 49 | 49 | 49 | 48 | 49 | 49 | 49 | 49 | 50 | 50 | 50 | 48.0 |
| Earliest Entry |
1972 | 1972 | 1972 | 1972 | 1972 | 1972 | 1972 | 1972 | 1971 | 1971 | 1971 | 1971 | 1971 |
| Latest Entry |
2024 | 2024 | 2024 | 2024 | 2024 | 2023 | 2023 | 2023 | 2023 | 2023 | 2023 | 2023 | 2024 |
Station Details
GOULBURN TAFE
Southern Tablelands, New South Wales/ACT
Southern Tablelands, New South Wales/ACT
34.7495°S 149.7034°E
670m AMSL
Commenced 1971
Commenced 1971
Enter a postcode or town name for local weather, or text to search the site. » advanced search
Warm and humid May breaks records
13:47 AEST With the welcoming of a new month as well as a new season, we reminisce on the weather that made May so significant. In literally every far-reaching corner of the country, notable highs and lows in moisture and temperature were observed for as long as records have been around. At Sydney Airport, May 2024 was the most humid May since records began in 2005 (2.3ºC average dewpoint departure from temperature).
- 16:38 AEST Destructive winds possible for western WA (including Perth)
- 14:56 AEST Winter starts chilly
- 12:06 AEST Wet weekend ahead for eastern Australia
- 11:09 AEST 146 km/h winds at the top of Australia