Australian long range seasonal weather forecast ENSO La Nina El Nino
Climate Drivers and Outlooks

Map Type
Observations update weekly on Monday evenings, forecasts update monthly around the 12th
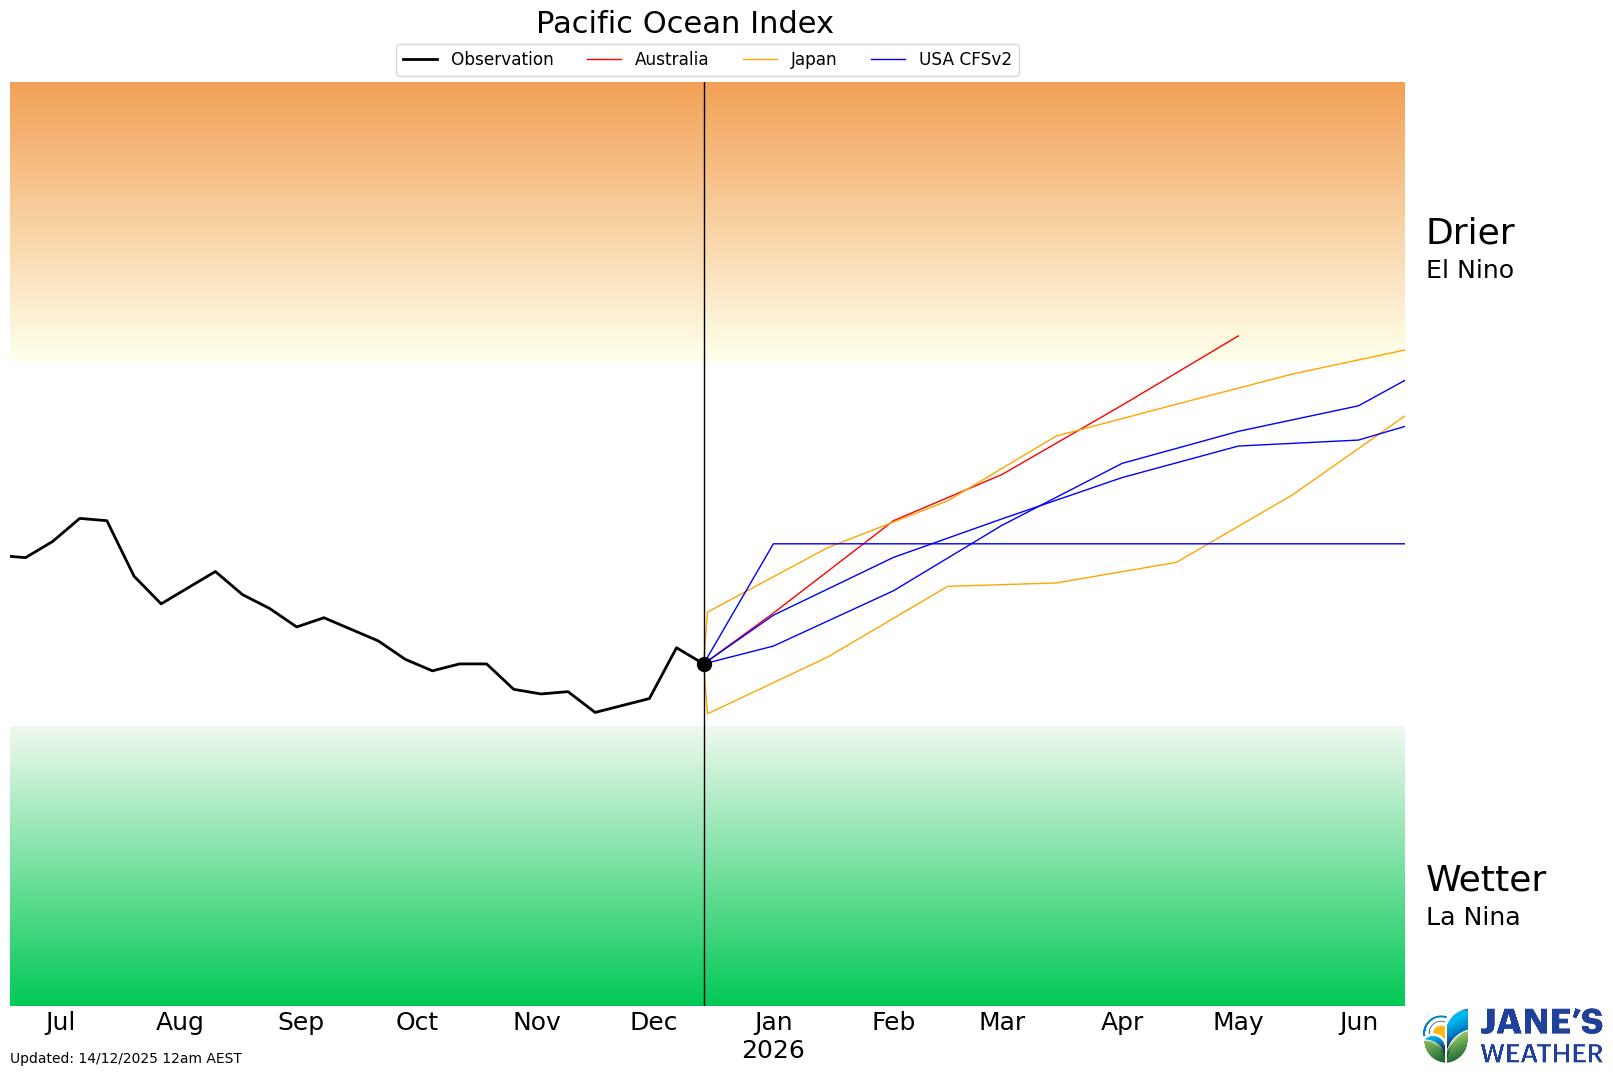
The temperature of the Pacific Ocean box, and forecasts from only the BoM model over the next six months.
If the forecast enters the green area, the Pacific Ocean should push tropical moisture towards Australia (known as La Nina). When low pressure moves through it helps bring flooding rain, most felt in northern and eastern AUS.
If the forecast enters the brown area, the Pacific Ocean should push tropical moisture away from Australia (known as El Nino). This leads to drier than average conditions, even if low pressure is nearby, as there is less moisture available to feed them.
Advertisement