- WEATHER
Australia
- National
- New South Wales
- Victoria
- Queensland
- Western Australia
- South Australia
- Tasmania
- ACT
- Northern Territory
Long Range Forecasts
- WARNINGS
- RADAR
- SATELLITE
- MAPS & CHARTS
- LONG RANGE
Long Range Forecasts
- CLIMATE
Climate Indicators
- NEWS
Northern Territory Sea Surface Temperature Anomalies
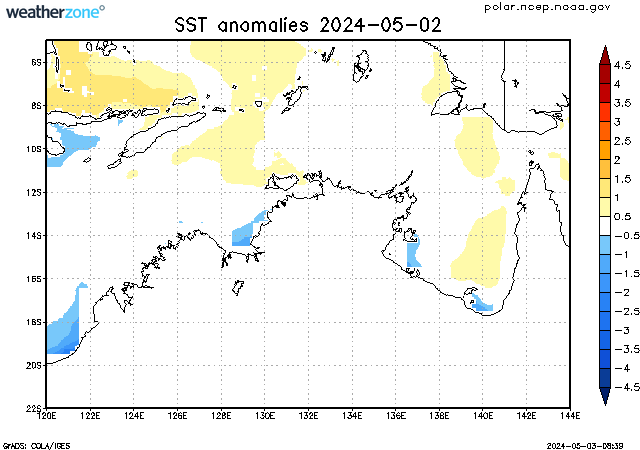
The sea surface temperature anomaly (SSTA) is the difference between the observed SST and the climatological SST. These anomalies are calculated on a weekly basis.
Positive SSTAs are usually correlated with increased regions of convection (cloudiness and rainfall) while negative SSTAs are usually correlated to reduced convection.
SSTAs can be used as an indicator of the phase of global climate fluctuations, such as the El Nino/Southern Oscillation (ENSO).
The data displayed in this map is the weekly average, centred on the date shown.
Enter a postcode or town name for local weather, or text to search the site. » advanced search
Australia's hottest and 4th-wettest March on record
20:20 AEDT With nationwide average temperatures that were 2.41°C above the long-term average, Australia has registered its hottest March since national records were first kept in 1910.