- WEATHER
Australia
- National
- New South Wales
- Victoria
- Queensland
- Western Australia
- South Australia
- Tasmania
- ACT
- Northern Territory
Long Range Forecasts
- WARNINGS
- RADAR
- SATELLITE
- MAPS & CHARTS
- LONG RANGE
Long Range Forecasts
- CLIMATE
Climate Indicators
- NEWS
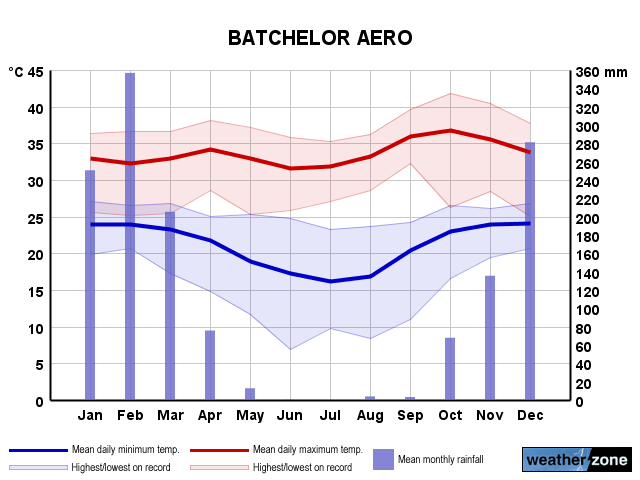
Batchelor Ap Long-term Averages
| Jan | Feb | Mar | Apr | May | Jun | Jul | Aug | Sep | Oct | Nov | Dec | Ann | |
|---|---|---|---|---|---|---|---|---|---|---|---|---|---|
| Mean Max (°C) |
32.7 | 32.5 | 33.2 | 33.8 | 32.9 | 31.8 | 32.0 | 33.6 | 36.2 | 36.8 | 35.7 | 34.0 | 33.8 |
| Mean Min (°C) |
24.0 | 23.9 | 23.6 | 21.9 | 19.1 | 17.2 | 16.5 | 17.2 | 20.7 | 23.2 | 24.0 | 24.2 | 21.2 |
| Mean Rain (mm) |
350.5 | 333.7 | 253.6 | 94.3 | 23.6 | 0.6 | 0.8 | 2.0 | 11.3 | 63.7 | 138.0 | 298.8 | 1586.0 |
| Median Rain (mm) |
274.0 | 317.3 | 298.0 | 24.0 | 0.0 | 0.0 | 0.0 | 0.0 | 3.2 | 51.4 | 124.2 | 260.1 | 1733.6 |
| Mean Rain Days |
21.7 | 20.3 | 19.3 | 7.4 | 2.2 | 0.6 | 0.2 | 0.5 | 2.0 | 7.6 | 13.3 | 18.7 | 114.7 |
Batchelor Ap Daily Records
| Jan | Feb | Mar | Apr | May | Jun | Jul | Aug | Sep | Oct | Nov | Dec | Ann | |
|---|---|---|---|---|---|---|---|---|---|---|---|---|---|
| High Max (°C) |
38.5 | 37.3 | 36.6 | 38.1 | 37.1 | 46.1 | 36.4 | 38.0 | 39.6 | 41.9 | 41.2 | 39.8 | 46.1 |
| Low Max (°C) |
24.5 | 23.9 | 24.8 | 23.6 | 22.8 | 21.0 | 23.6 | 21.0 | 26.2 | 26.1 | 25.2 | 25.0 | 21.0 |
| High Min (°C) |
27.8 | 27.6 | 26.9 | 25.7 | 25.3 | 25.0 | 24.7 | 25.3 | 25.6 | 26.6 | 27.1 | 27.4 | 27.8 |
| Low Min (°C) |
19.8 | 20.7 | 15.5 | 12.6 | 9.6 | 6.9 | 7.8 | 8.4 | 10.4 | 16.6 | 19.1 | 19.1 | 6.9 |
| High Rain (mm) |
134.4 | 179.8 | 197.8 | 127.6 | 101.4 | 3.8 | 15.2 | 23.0 | 36.0 | 54.6 | 87.0 | 257.4 | 257.4 |
Batchelor Ap Monthly Records
| Jan | Feb | Mar | Apr | May | Jun | Jul | Aug | Sep | Oct | Nov | Dec | Ann | |
|---|---|---|---|---|---|---|---|---|---|---|---|---|---|
| High Mn. Max (°C) |
34.3 | 34.5 | 34.6 | 36.4 | 35.0 | 34.1 | 33.7 | 35.0 | 37.0 | 38.9 | 37.8 | 36.3 | 34.8 |
| Low Mn. Max (°C) |
30.8 | 30.4 | 31.3 | 31.7 | 30.5 | 29.4 | 29.9 | 31.7 | 35.1 | 34.7 | 33.4 | 32.0 | 32.5 |
| High Mn. Min (°C) |
24.7 | 24.9 | 24.8 | 23.3 | 22.6 | 19.7 | 20.7 | 19.6 | 23.2 | 24.4 | 24.5 | 25.0 | 22.5 |
| Low Mn. Min (°C) |
23.3 | 23.3 | 22.4 | 17.8 | 15.4 | 12.7 | 13.9 | 14.4 | 18.1 | 21.2 | 23.1 | 23.7 | 20.3 |
| High Rain (mm) |
757.2 | 670.4 | 702.2 | 460.4 | 150.0 | 3.8 | 15.2 | 23.0 | 45.0 | 161.8 | 260.0 | 701.6 | 2294.0 |
| Low Rain (mm) |
110.6 | 72.8 | 20.6 | 0.0 | 0.0 | 0.0 | 0.0 | 0.0 | 0.0 | 0.0 | 5.8 | 87.2 | 946.8 |
Batchelor Ap Annual Temperatures & Rainfall
Batchelor Ap Average Number of Days With Temperatures
| Jan | Feb | Mar | Apr | May | Jun | Jul | Aug | Sep | Oct | Nov | Dec | Ann | |
|---|---|---|---|---|---|---|---|---|---|---|---|---|---|
| ≥ 40°C |
0.0 | 0.0 | 0.0 | 0.0 | 0.0 | 0.1 | 0.0 | 0.0 | 0.0 | 0.7 | 0.2 | 0.0 | 1.0 |
| ≥ 35°C |
4.5 | 3.7 | 4.3 | 6.5 | 3.5 | 0.8 | 0.9 | 5.7 | 24.4 | 26.9 | 20.2 | 12.4 | 114.1 |
| ≥ 30°C |
26.3 | 24.4 | 28.2 | 28.6 | 28.6 | 24.1 | 26.4 | 30.3 | 29.5 | 30.5 | 29.0 | 27.8 | 332.4 |
| ≤ 2°C |
0.0 | 0.0 | 0.0 | 0.0 | 0.0 | 0.0 | 0.0 | 0.0 | 0.0 | 0.0 | 0.0 | 0.0 | 0.0 |
| ≤ 0°C |
0.0 | 0.0 | 0.0 | 0.0 | 0.0 | 0.0 | 0.0 | 0.0 | 0.0 | 0.0 | 0.0 | 0.0 | 0.0 |
Batchelor Ap 'per Week' Values (14th/86th Percentiles)
| Jan | Feb | Mar | Apr | May | Jun | Jul | Aug | Sep | Oct | Nov | Dec | Ann | |
|---|---|---|---|---|---|---|---|---|---|---|---|---|---|
| High Max |
34.7 | 34.6 | 34.7 | 35.7 | 35.0 | 33.9 | 33.7 | 35.0 | 37.6 | 38.8 | 37.6 | 36.2 | 36.4 |
| Low Max |
30.3 | 30.0 | 31.0 | 32.5 | 30.9 | 28.9 | 29.9 | 31.8 | 34.5 | 35.0 | 33.7 | 31.3 | 31.0 |
| High Min |
25.1 | 24.9 | 24.4 | 23.7 | 22.3 | 20.3 | 19.2 | 20.0 | 23.0 | 24.6 | 25.2 | 25.0 | 24.5 |
| Low Min |
22.9 | 22.8 | 22.4 | 19.1 | 15.2 | 13.1 | 13.0 | 14.3 | 18.4 | 21.3 | 22.7 | 23.0 | 16.7 |
Batchelor Ap Data Availability
| Jan | Feb | Mar | Apr | May | Jun | Jul | Aug | Sep | Oct | Nov | Dec | Ann | |
|---|---|---|---|---|---|---|---|---|---|---|---|---|---|
| Years of Minima |
29 | 30 | 26 | 27 | 27 | 27 | 27 | 27 | 26 | 28 | 27 | 29 | 27.0 |
| Earliest Entry |
1994 | 1994 | 1997 | 1997 | 1997 | 1997 | 1993 | 1992 | 1992 | 1993 | 1993 | 1993 | 1992 |
| Latest Entry |
2025 | 2025 | 2025 | 2024 | 2024 | 2024 | 2024 | 2024 | 2024 | 2024 | 2024 | 2024 | 2025 |
| Years of Maxima |
28 | 29 | 27 | 27 | 27 | 27 | 26 | 27 | 26 | 28 | 27 | 29 | 27.0 |
| Earliest Entry |
1994 | 1994 | 1997 | 1997 | 1997 | 1997 | 1993 | 1992 | 1992 | 1993 | 1993 | 1993 | 1992 |
| Latest Entry |
2025 | 2025 | 2025 | 2024 | 2024 | 2024 | 2024 | 2024 | 2024 | 2024 | 2024 | 2024 | 2025 |
| Years of Rainfall |
28 | 28 | 26 | 27 | 28 | 27 | 28 | 28 | 28 | 29 | 27 | 28 | 26.0 |
| Earliest Entry |
1996 | 1996 | 1995 | 1995 | 1995 | 1995 | 1995 | 1995 | 1994 | 1994 | 1994 | 1994 | 1994 |
| Latest Entry |
2025 | 2025 | 2025 | 2024 | 2024 | 2024 | 2024 | 2024 | 2024 | 2024 | 2024 | 2024 | 2025 |
Station Details
BATCHELOR AIRPORT
Darwin-Daly, Northern Territory
Darwin-Daly, Northern Territory
13.0544°S 131.0252°E
104m AMSL
Commenced 1992
Commenced 1992
Enter a postcode or town name for local weather, or text to search the site. » advanced search
Nearly a million lightning strikes on wild NSW night
11:34 AEST Skies were ablaze over coastal New South Wales as the sun set on the Easter break, with a total of 878,269 lightning strikes detected within a 600km radius of Sydney.