- WEATHER
Australia
- National
- New South Wales
- Victoria
- Queensland
- Western Australia
- South Australia
- Tasmania
- ACT
- Northern Territory
Long Range Forecasts
- WARNINGS
- RADAR
- SATELLITE
- MAPS & CHARTS
- LONG RANGE
Long Range Forecasts
- CLIMATE
Climate Indicators
- NEWS
McArthur River Long-term Averages
| Jan | Feb | Mar | Apr | May | Jun | Jul | Aug | Sep | Oct | Nov | Dec | Ann | |
|---|---|---|---|---|---|---|---|---|---|---|---|---|---|
| Mean Max (°C) |
36.0 | 35.4 | 35.4 | 34.9 | 32.6 | 30.1 | 30.1 | 32.4 | 35.5 | 38.1 | 38.7 | 37.9 | 34.8 |
| Mean Min (°C) |
25.1 | 24.8 | 23.7 | 20.7 | 16.8 | 13.1 | 12.3 | 13.6 | 17.3 | 21.4 | 24.3 | 25.2 | 19.8 |
| Mean Rain (mm) |
207.0 | 184.2 | 141.5 | 32.1 | 6.1 | 1.6 | 2.5 | 0.3 | 4.5 | 19.2 | 57.1 | 129.4 | 781.1 |
| Median Rain (mm) |
170.0 | 162.1 | 109.2 | 14.4 | 0.4 | 0.0 | 0.0 | 0.0 | 0.0 | 1.6 | 37.2 | 88.6 | 669.5 |
| Mean Rain Days |
14.4 | 13.4 | 10.7 | 3.5 | 1.1 | 0.5 | 0.4 | 0.3 | 0.7 | 2.1 | 6.1 | 10.1 | 62.4 |
McArthur River Daily Records
| Jan | Feb | Mar | Apr | May | Jun | Jul | Aug | Sep | Oct | Nov | Dec | Ann | |
|---|---|---|---|---|---|---|---|---|---|---|---|---|---|
| High Max (°C) |
45.0 | 45.3 | 43.4 | 40.2 | 37.7 | 35.7 | 36.2 | 38.4 | 40.9 | 43.7 | 44.3 | 46.0 | 46.0 |
| Low Max (°C) |
24.5 | 25.1 | 24.8 | 22.2 | 20.2 | 17.7 | 16.9 | 20.0 | 22.9 | 28.0 | 28.3 | 25.8 | 16.9 |
| High Min (°C) |
32.6 | 30.0 | 29.3 | 27.3 | 25.7 | 23.7 | 23.2 | 23.7 | 29.5 | 29.4 | 29.9 | 32.3 | 32.6 |
| Low Min (°C) |
16.0 | 17.0 | 13.8 | 7.5 | 3.2 | 1.6 | 1.0 | 2.7 | 6.0 | 9.3 | 14.5 | 16.5 | 1.0 |
| High Rain (mm) |
196.4 | 197.6 | 274.4 | 162.2 | 86.4 | 15.0 | 49.0 | 11.6 | 48.4 | 90.6 | 200.4 | 122.4 | 274.4 |
McArthur River Monthly Records
| Jan | Feb | Mar | Apr | May | Jun | Jul | Aug | Sep | Oct | Nov | Dec | Ann | |
|---|---|---|---|---|---|---|---|---|---|---|---|---|---|
| High Mn. Max (°C) |
40.0 | 39.9 | 39.6 | 37.5 | 34.8 | 32.7 | 33.0 | 34.7 | 37.2 | 39.8 | 40.7 | 41.6 | 36.0 |
| Low Mn. Max (°C) |
31.5 | 32.1 | 32.3 | 31.3 | 30.1 | 26.6 | 27.5 | 30.4 | 32.3 | 35.8 | 35.8 | 34.5 | 33.1 |
| High Mn. Min (°C) |
26.4 | 27.0 | 25.4 | 23.1 | 22.1 | 17.4 | 17.5 | 15.7 | 22.0 | 24.6 | 26.5 | 27.4 | 21.9 |
| Low Mn. Min (°C) |
22.0 | 23.0 | 20.5 | 17.0 | 13.0 | 9.0 | 8.8 | 9.3 | 12.0 | 16.9 | 22.1 | 22.9 | 17.4 |
| High Rain (mm) |
782.3 | 660.9 | 562.1 | 213.6 | 160.1 | 18.2 | 56.6 | 12.6 | 89.6 | 184.6 | 266.0 | 435.2 | 1604.0 |
| Low Rain (mm) |
10.1 | 5.2 | 5.4 | 0.0 | 0.0 | 0.0 | 0.0 | 0.0 | 0.0 | 0.0 | 4.4 | 8.8 | 293.6 |
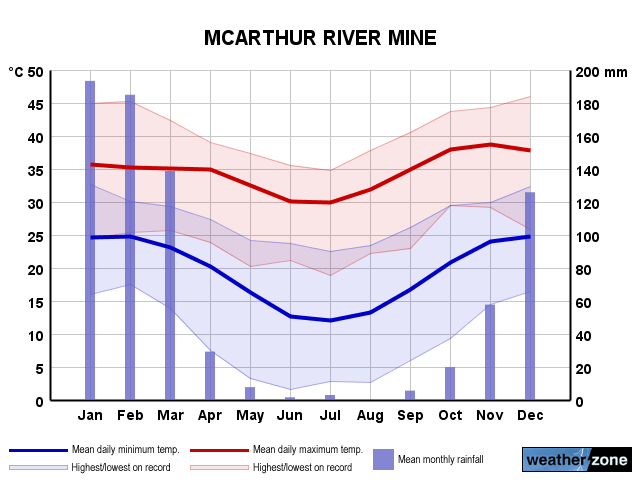
McArthur River Annual Temperatures & Rainfall
McArthur River Average Number of Days With Temperatures
| Jan | Feb | Mar | Apr | May | Jun | Jul | Aug | Sep | Oct | Nov | Dec | Ann | |
|---|---|---|---|---|---|---|---|---|---|---|---|---|---|
| ≥ 40°C |
3.4 | 1.7 | 1.3 | 0.0 | 0.0 | 0.0 | 0.0 | 0.0 | 0.2 | 5.5 | 8.6 | 7.2 | 26.5 |
| ≥ 35°C |
19.4 | 16.1 | 19.4 | 16.5 | 3.7 | 0.3 | 0.4 | 3.9 | 18.7 | 27.7 | 26.8 | 25.0 | 171.3 |
| ≥ 30°C |
28.7 | 26.1 | 28.8 | 28.1 | 25.8 | 16.8 | 17.6 | 25.9 | 28.1 | 29.4 | 28.6 | 29.3 | 300.2 |
| ≤ 2°C |
0.0 | 0.0 | 0.0 | 0.0 | 0.0 | 0.0 | 0.0 | 0.0 | 0.0 | 0.0 | 0.0 | 0.0 | 0.0 |
| ≤ 0°C |
0.0 | 0.0 | 0.0 | 0.0 | 0.0 | 0.0 | 0.0 | 0.0 | 0.0 | 0.0 | 0.0 | 0.0 | 0.0 |
McArthur River 'per Week' Values (14th/86th Percentiles)
| Jan | Feb | Mar | Apr | May | Jun | Jul | Aug | Sep | Oct | Nov | Dec | Ann | |
|---|---|---|---|---|---|---|---|---|---|---|---|---|---|
| High Max |
39.4 | 38.5 | 37.6 | 36.7 | 34.7 | 32.6 | 32.5 | 34.5 | 37.6 | 40.0 | 40.7 | 40.7 | 38.8 |
| Low Max |
32.2 | 31.7 | 32.3 | 32.9 | 29.8 | 26.9 | 27.0 | 29.5 | 33.0 | 35.6 | 36.6 | 34.8 | 30.2 |
| High Min |
26.6 | 26.2 | 25.2 | 23.4 | 20.7 | 17.4 | 16.8 | 17.7 | 21.7 | 24.6 | 26.7 | 27.2 | 25.4 |
| Low Min |
23.3 | 23.3 | 21.2 | 17.1 | 12.4 | 7.7 | 7.1 | 9.2 | 12.8 | 17.4 | 21.5 | 23.0 | 12.4 |
McArthur River Data Availability
| Jan | Feb | Mar | Apr | May | Jun | Jul | Aug | Sep | Oct | Nov | Dec | Ann | |
|---|---|---|---|---|---|---|---|---|---|---|---|---|---|
| Years of Minima |
43 | 45 | 43 | 42 | 42 | 45 | 41 | 42 | 39 | 42 | 44 | 40 | 41.0 |
| Earliest Entry |
1969 | 1969 | 1969 | 1969 | 1969 | 1969 | 1969 | 1969 | 1969 | 1969 | 1969 | 1969 | 1969 |
| Latest Entry |
2025 | 2025 | 2025 | 2024 | 2024 | 2024 | 2024 | 2024 | 2024 | 2024 | 2024 | 2024 | 2025 |
| Years of Maxima |
42 | 46 | 43 | 42 | 42 | 45 | 43 | 42 | 38 | 41 | 43 | 40 | 42.0 |
| Earliest Entry |
1969 | 1969 | 1969 | 1969 | 1969 | 1969 | 1969 | 1969 | 1969 | 1969 | 1969 | 1969 | 1969 |
| Latest Entry |
2025 | 2025 | 2025 | 2024 | 2024 | 2024 | 2024 | 2024 | 2024 | 2024 | 2024 | 2024 | 2025 |
| Years of Rainfall |
54 | 53 | 51 | 53 | 52 | 53 | 53 | 52 | 51 | 52 | 52 | 50 | 51.0 |
| Earliest Entry |
1969 | 1969 | 1968 | 1968 | 1968 | 1968 | 1968 | 1968 | 1968 | 1968 | 1968 | 1968 | 1968 |
| Latest Entry |
2025 | 2025 | 2025 | 2024 | 2024 | 2024 | 2024 | 2024 | 2024 | 2024 | 2024 | 2024 | 2025 |
Station Details
MCARTHUR RIVER MINE AIRPORT
Roper-McArthur, Northern Territory
Roper-McArthur, Northern Territory
16.4423°S 136.0760°E
40m AMSL
Commenced 1968
Commenced 1968
Enter a postcode or town name for local weather, or text to search the site. » advanced search
Strong positive SAM influencing Australia's weather ? here's what to expect
17:43 AEST This week’s weather patterns across Australia will be influenced by a strong positive Southern Annular Mode (SAM), increasing the likelihood of rain in some parts of the country and bringing a week of dry weather to others.