- WEATHER
Australia
- National
- New South Wales
- Victoria
- Queensland
- Western Australia
- South Australia
- Tasmania
- ACT
- Northern Territory
Long Range Forecasts
- WARNINGS
- RADAR
- SATELLITE
- MAPS & CHARTS
- LONG RANGE
Long Range Forecasts
- CLIMATE
Climate Indicators
- NEWS
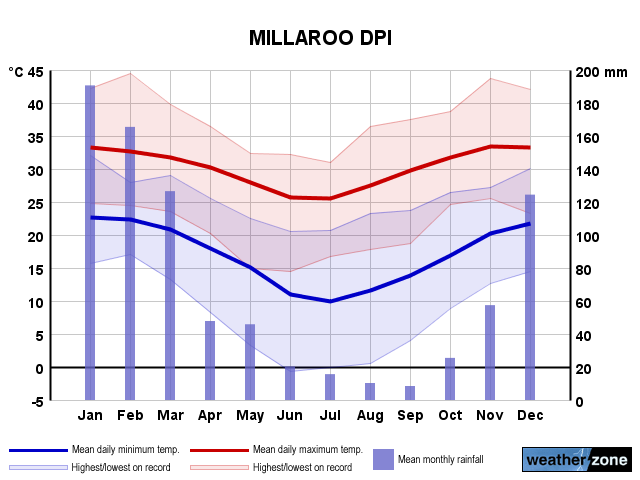
Millaroo Dpi Long-term Averages
| Jan | Feb | Mar | Apr | May | Jun | Jul | Aug | Sep | Oct | Nov | Dec | Ann | |
|---|---|---|---|---|---|---|---|---|---|---|---|---|---|
| Mean Max (°C) |
33.2 | 32.6 | 31.8 | 30.3 | 28.0 | 25.7 | 25.4 | 27.4 | 29.8 | 31.8 | 33.3 | 33.5 | 30.2 |
| Mean Min (°C) |
22.7 | 22.4 | 21.0 | 17.9 | 15.1 | 11.2 | 9.9 | 11.6 | 13.8 | 17.3 | 20.4 | 21.9 | 17.1 |
| Mean Rain (mm) |
186.7 | 166.0 | 126.4 | 45.4 | 45.9 | 20.3 | 15.7 | 10.4 | 8.5 | 25.6 | 57.4 | 116.7 | 825.0 |
| Median Rain (mm) |
141.6 | 138.2 | 105.6 | 29.4 | 26.7 | 8.0 | 5.1 | 4.4 | 1.4 | 8.8 | 32.6 | 76.3 | 848.3 |
| Mean Rain Days |
11.5 | 12.1 | 10.3 | 6.0 | 5.5 | 3.1 | 3.0 | 3.0 | 2.0 | 3.4 | 6.0 | 8.4 | 72.1 |
Millaroo Dpi Daily Records
| Jan | Feb | Mar | Apr | May | Jun | Jul | Aug | Sep | Oct | Nov | Dec | Ann | |
|---|---|---|---|---|---|---|---|---|---|---|---|---|---|
| High Max (°C) |
42.2 | 44.4 | 39.7 | 36.5 | 33.0 | 32.2 | 31.0 | 36.4 | 37.5 | 38.7 | 43.7 | 42.0 | 44.4 |
| Low Max (°C) |
24.8 | 24.5 | 23.5 | 20.2 | 15.0 | 14.4 | 16.7 | 17.8 | 18.7 | 24.6 | 24.6 | 23.3 | 14.4 |
| High Min (°C) |
32.1 | 28.0 | 29.0 | 25.5 | 24.0 | 21.0 | 20.7 | 23.3 | 23.7 | 26.5 | 27.2 | 30.0 | 32.1 |
| Low Min (°C) |
15.7 | 17.0 | 13.2 | 8.3 | 3.3 | -0.7 | 0.0 | 0.5 | 4.0 | 8.9 | 12.2 | 14.4 | -0.7 |
| High Rain (mm) |
319.8 | 177.0 | 205.4 | 71.1 | 105.4 | 75.9 | 39.0 | 25.7 | 39.6 | 50.6 | 83.8 | 155.7 | 319.8 |
Millaroo Dpi Monthly Records
| Jan | Feb | Mar | Apr | May | Jun | Jul | Aug | Sep | Oct | Nov | Dec | Ann | |
|---|---|---|---|---|---|---|---|---|---|---|---|---|---|
| High Mn. Max (°C) |
36.3 | 36.2 | 34.9 | 32.0 | 29.6 | 27.9 | 27.6 | 28.9 | 31.4 | 34.5 | 35.6 | 35.9 | 31.8 |
| Low Mn. Max (°C) |
29.6 | 30.0 | 29.8 | 28.4 | 26.1 | 23.6 | 22.8 | 25.2 | 27.9 | 30.3 | 31.0 | 30.1 | 29.2 |
| High Mn. Min (°C) |
24.5 | 23.9 | 22.6 | 20.0 | 19.4 | 15.1 | 13.7 | 13.6 | 17.3 | 20.9 | 22.7 | 24.0 | 18.6 |
| Low Mn. Min (°C) |
21.3 | 20.2 | 18.6 | 15.7 | 12.5 | 6.3 | 5.8 | 8.1 | 11.1 | 14.2 | 18.3 | 19.8 | 15.4 |
| High Rain (mm) |
598.2 | 612.4 | 395.5 | 194.4 | 205.3 | 118.5 | 70.2 | 61.6 | 60.4 | 117.6 | 267.5 | 382.1 | 1341.4 |
| Low Rain (mm) |
4.7 | 11.0 | 4.6 | 0.0 | 0.0 | 0.0 | 0.0 | 0.0 | 0.0 | 0.0 | 0.0 | 11.0 | 362.0 |
Millaroo Dpi Annual Temperatures & Rainfall
Millaroo Dpi Average Number of Days With Temperatures
| Jan | Feb | Mar | Apr | May | Jun | Jul | Aug | Sep | Oct | Nov | Dec | Ann | |
|---|---|---|---|---|---|---|---|---|---|---|---|---|---|
| ≥ 40°C |
0.4 | 0.1 | 0.0 | 0.0 | 0.0 | 0.0 | 0.0 | 0.0 | 0.0 | 0.0 | 0.4 | 0.2 | 1.1 |
| ≥ 35°C |
9.0 | 4.5 | 1.9 | 0.2 | 0.0 | 0.0 | 0.0 | 0.0 | 0.6 | 2.7 | 5.8 | 8.9 | 32.8 |
| ≥ 30°C |
25.8 | 24.1 | 24.6 | 18.1 | 5.6 | 0.3 | 0.3 | 3.6 | 13.6 | 25.5 | 26.5 | 25.4 | 188.7 |
| ≤ 2°C |
0.0 | 0.0 | 0.0 | 0.0 | 0.0 | 0.6 | 1.0 | 0.1 | 0.0 | 0.0 | 0.0 | 0.0 | 1.6 |
| ≤ 0°C |
0.0 | 0.0 | 0.0 | 0.0 | 0.0 | 0.1 | 0.1 | 0.0 | 0.0 | 0.0 | 0.0 | 0.0 | 0.1 |
Millaroo Dpi 'per Week' Values (14th/86th Percentiles)
| Jan | Feb | Mar | Apr | May | Jun | Jul | Aug | Sep | Oct | Nov | Dec | Ann | |
|---|---|---|---|---|---|---|---|---|---|---|---|---|---|
| High Max |
36.0 | 35.0 | 33.9 | 32.5 | 30.1 | 28.0 | 27.8 | 29.5 | 32.0 | 34.2 | 35.5 | 36.1 | 34.2 |
| Low Max |
30.0 | 30.0 | 29.4 | 28.3 | 25.6 | 23.3 | 23.1 | 25.0 | 27.8 | 29.8 | 31.1 | 30.6 | 26.1 |
| High Min |
24.7 | 24.4 | 23.3 | 20.7 | 19.0 | 15.8 | 14.6 | 15.7 | 17.5 | 21.0 | 23.3 | 24.5 | 23.0 |
| Low Min |
20.6 | 20.5 | 18.5 | 15.2 | 11.1 | 6.2 | 4.6 | 7.0 | 10.2 | 14.0 | 17.5 | 19.1 | 10.6 |
Millaroo Dpi Data Availability
| Jan | Feb | Mar | Apr | May | Jun | Jul | Aug | Sep | Oct | Nov | Dec | Ann | |
|---|---|---|---|---|---|---|---|---|---|---|---|---|---|
| Years of Minima |
27 | 28 | 28 | 27 | 27 | 27 | 27 | 27 | 27 | 27 | 27 | 26 | 27.0 |
| Earliest Entry |
1965 | 1965 | 1965 | 1965 | 1965 | 1965 | 1965 | 1965 | 1965 | 1965 | 1965 | 1965 | 1965 |
| Latest Entry |
1993 | 1993 | 1993 | 1993 | 1993 | 1993 | 1992 | 1992 | 1992 | 1992 | 1992 | 1992 | 1993 |
| Years of Maxima |
27 | 28 | 28 | 27 | 28 | 27 | 27 | 26 | 26 | 26 | 26 | 25 | 26.7 |
| Earliest Entry |
1965 | 1965 | 1965 | 1965 | 1965 | 1965 | 1965 | 1965 | 1965 | 1965 | 1965 | 1965 | 1965 |
| Latest Entry |
1993 | 1993 | 1993 | 1993 | 1993 | 1993 | 1992 | 1992 | 1992 | 1992 | 1992 | 1992 | 1993 |
| Years of Rainfall |
35 | 35 | 35 | 35 | 35 | 35 | 34 | 34 | 35 | 35 | 35 | 35 | 34.7 |
| Earliest Entry |
1959 | 1959 | 1959 | 1959 | 1959 | 1959 | 1959 | 1959 | 1958 | 1958 | 1958 | 1958 | 1958 |
| Latest Entry |
1993 | 1993 | 1993 | 1993 | 1993 | 1993 | 1992 | 1992 | 1992 | 1992 | 1992 | 1992 | 1993 |
Station Details
MILLAROO DPI
Lower Burdekin, Queensland
Lower Burdekin, Queensland
20.0464°S 147.2739°E
45m AMSL
Commenced 1958 / Closed 1993
Commenced 1958 / Closed 1993
Enter a postcode or town name for local weather, or text to search the site. » advanced search
Damaging winds in Perth shatter trees and reroute flights
16:21 AEDT A noteworthy easterly wind event occurred across southwest WA from Friday into Saturday morning, triggering the Bureau of Meteorology (BoM) to issue warnings for damaging winds across the Darling Escarpment, including for the Perth Hills and foothills area.