- WEATHER
Australia
- National
- New South Wales
- Victoria
- Queensland
- Western Australia
- South Australia
- Tasmania
- ACT
- Northern Territory
Long Range Forecasts
- WARNINGS
- RADAR
- SATELLITE
- MAPS & CHARTS
- LONG RANGE
Long Range Forecasts
- CLIMATE
Climate Indicators
- NEWS
Richmond Long-term Averages
| Jan | Feb | Mar | Apr | May | Jun | Jul | Aug | Sep | Oct | Nov | Dec | Ann | |
|---|---|---|---|---|---|---|---|---|---|---|---|---|---|
| Mean Max (°C) |
30.3 | 29.3 | 27.1 | 24.2 | 20.9 | 18.0 | 17.9 | 19.9 | 23.0 | 25.4 | 27.1 | 29.1 | 24.3 |
| Mean Min (°C) |
18.0 | 17.8 | 15.9 | 11.8 | 7.5 | 5.1 | 3.8 | 4.7 | 8.0 | 11.2 | 14.2 | 16.3 | 11.1 |
| Mean Rain (mm) |
83.0 | 113.0 | 103.1 | 60.8 | 42.7 | 53.3 | 35.3 | 32.5 | 44.1 | 51.8 | 79.2 | 65.6 | 766.4 |
| Median Rain (mm) |
64.0 | 116.4 | 57.2 | 31.6 | 36.8 | 29.6 | 24.6 | 16.4 | 33.2 | 30.2 | 73.6 | 57.4 | 693.9 |
| Mean Rain Days |
12.4 | 12.2 | 12.6 | 10.2 | 10.5 | 10.9 | 8.7 | 6.8 | 8.0 | 9.3 | 11.5 | 11.0 | 123.8 |
Richmond Daily Records
| Jan | Feb | Mar | Apr | May | Jun | Jul | Aug | Sep | Oct | Nov | Dec | Ann | |
|---|---|---|---|---|---|---|---|---|---|---|---|---|---|
| High Max (°C) |
47.4 | 47.0 | 40.0 | 36.6 | 29.0 | 26.2 | 27.9 | 31.3 | 36.9 | 40.1 | 45.3 | 45.0 | 47.4 |
| Low Max (°C) |
18.8 | 18.1 | 16.6 | 15.0 | 13.0 | 8.3 | 9.5 | 12.3 | 12.6 | 13.6 | 14.2 | 14.6 | 8.3 |
| High Min (°C) |
26.2 | 25.8 | 23.1 | 21.8 | 17.7 | 14.4 | 14.1 | 17.0 | 19.6 | 21.4 | 24.9 | 25.0 | 26.2 |
| Low Min (°C) |
8.6 | 10.3 | 6.0 | -0.4 | -2.1 | -6.4 | -5.2 | -4.0 | -1.4 | 3.0 | 5.3 | 7.0 | -6.4 |
| High Rain (mm) |
111.8 | 112.8 | 126.4 | 133.2 | 77.0 | 82.0 | 88.8 | 71.8 | 89.4 | 56.6 | 55.4 | 42.0 | 133.2 |
Richmond Monthly Records
| Jan | Feb | Mar | Apr | May | Jun | Jul | Aug | Sep | Oct | Nov | Dec | Ann | |
|---|---|---|---|---|---|---|---|---|---|---|---|---|---|
| High Mn. Max (°C) |
34.2 | 32.6 | 30.3 | 28.1 | 23.9 | 20.1 | 20.4 | 22.8 | 26.2 | 28.4 | 30.5 | 33.0 | 26.1 |
| Low Mn. Max (°C) |
26.5 | 25.6 | 24.7 | 21.3 | 19.3 | 14.8 | 15.9 | 17.5 | 20.8 | 23.0 | 23.1 | 23.9 | 22.8 |
| High Mn. Min (°C) |
21.1 | 19.1 | 18.5 | 14.5 | 10.6 | 7.7 | 6.5 | 8.6 | 10.0 | 13.0 | 16.4 | 18.2 | 12.4 |
| Low Mn. Min (°C) |
15.0 | 15.4 | 13.9 | 8.5 | 4.4 | 2.3 | 0.8 | 1.7 | 6.0 | 8.8 | 12.0 | 14.0 | 10.2 |
| High Rain (mm) |
266.4 | 280.4 | 591.2 | 353.0 | 168.4 | 246.8 | 207.6 | 159.0 | 158.0 | 233.4 | 254.6 | 229.4 | 1498.0 |
| Low Rain (mm) |
18.2 | 8.0 | 12.8 | 2.2 | 2.8 | 1.2 | 0.6 | 0.0 | 0.2 | 1.0 | 13.8 | 0.0 | 490.6 |
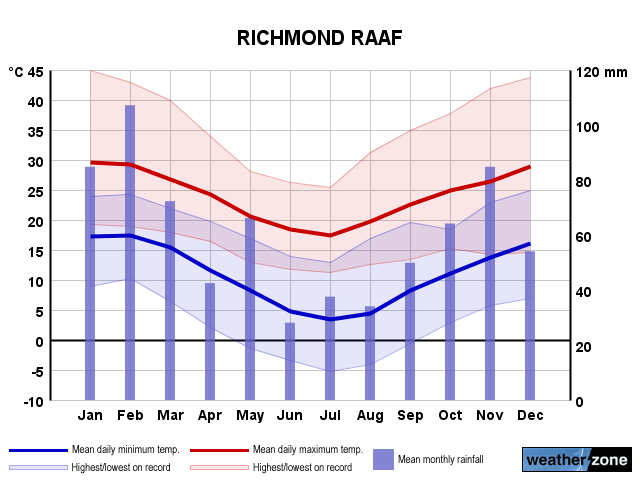
Richmond Annual Temperatures & Rainfall
Richmond Average Number of Days With Temperatures
| Jan | Feb | Mar | Apr | May | Jun | Jul | Aug | Sep | Oct | Nov | Dec | Ann | |
|---|---|---|---|---|---|---|---|---|---|---|---|---|---|
| ≥ 40°C |
1.6 | 0.6 | 0.0 | 0.0 | 0.0 | 0.0 | 0.0 | 0.0 | 0.0 | 0.0 | 0.3 | 0.6 | 3.1 |
| ≥ 35°C |
6.1 | 3.3 | 1.1 | 0.1 | 0.0 | 0.0 | 0.0 | 0.0 | 0.2 | 0.9 | 2.9 | 4.4 | 19.1 |
| ≥ 30°C |
15.3 | 11.8 | 6.7 | 1.2 | 0.0 | 0.0 | 0.0 | 0.2 | 2.0 | 6.0 | 8.3 | 13.0 | 64.7 |
| ≤ 2°C |
0.0 | 0.0 | 0.0 | 0.1 | 2.8 | 7.6 | 12.2 | 9.8 | 1.5 | 0.0 | 0.0 | 0.0 | 33.9 |
| ≤ 0°C |
0.0 | 0.0 | 0.0 | 0.0 | 0.7 | 3.0 | 6.0 | 3.8 | 0.2 | 0.0 | 0.0 | 0.0 | 13.8 |
Richmond 'per Week' Values (14th/86th Percentiles)
| Jan | Feb | Mar | Apr | May | Jun | Jul | Aug | Sep | Oct | Nov | Dec | Ann | |
|---|---|---|---|---|---|---|---|---|---|---|---|---|---|
| High Max |
36.2 | 34.0 | 30.9 | 27.5 | 23.2 | 20.2 | 19.9 | 23.2 | 27.3 | 30.8 | 32.3 | 34.0 | 30.6 |
| Low Max |
24.0 | 24.0 | 22.9 | 20.3 | 18.0 | 15.7 | 15.0 | 16.6 | 18.4 | 19.6 | 20.8 | 23.1 | 17.8 |
| High Min |
20.5 | 20.2 | 18.8 | 15.0 | 12.5 | 9.8 | 8.2 | 9.4 | 12.7 | 15.0 | 17.4 | 19.0 | 17.8 |
| Low Min |
14.8 | 14.7 | 12.2 | 7.5 | 2.9 | 0.1 | -0.7 | 0.0 | 3.9 | 6.6 | 10.3 | 12.8 | 3.3 |
Richmond Data Availability
| Jan | Feb | Mar | Apr | May | Jun | Jul | Aug | Sep | Oct | Nov | Dec | Ann | |
|---|---|---|---|---|---|---|---|---|---|---|---|---|---|
| Years of Minima |
31 | 31 | 30 | 30 | 30 | 30 | 30 | 30 | 30 | 30 | 31 | 31 | 30.0 |
| Earliest Entry |
1995 | 1995 | 1995 | 1995 | 1995 | 1995 | 1995 | 1995 | 1995 | 1995 | 1993 | 1993 | 1993 |
| Latest Entry |
2025 | 2025 | 2025 | 2024 | 2024 | 2024 | 2024 | 2024 | 2024 | 2024 | 2024 | 2024 | 2025 |
| Years of Maxima |
32 | 32 | 31 | 31 | 31 | 31 | 31 | 31 | 31 | 31 | 32 | 32 | 31.0 |
| Earliest Entry |
1994 | 1994 | 1994 | 1994 | 1994 | 1994 | 1994 | 1994 | 1994 | 1993 | 1993 | 1993 | 1993 |
| Latest Entry |
2025 | 2025 | 2025 | 2024 | 2024 | 2024 | 2024 | 2024 | 2024 | 2024 | 2024 | 2024 | 2025 |
| Years of Rainfall |
29 | 31 | 29 | 30 | 30 | 30 | 30 | 30 | 30 | 30 | 31 | 29 | 30.0 |
| Earliest Entry |
1995 | 1995 | 1995 | 1995 | 1995 | 1994 | 1994 | 1994 | 1994 | 1994 | 1994 | 1994 | 1994 |
| Latest Entry |
2025 | 2025 | 2025 | 2024 | 2024 | 2024 | 2024 | 2024 | 2024 | 2024 | 2024 | 2024 | 2025 |
Station Details
RICHMOND RAAF
Sydney, New South Wales/ACT
Sydney, New South Wales/ACT
33.6004°S 150.7761°E
19m AMSL
Commenced 1993
Commenced 1993
Enter a postcode or town name for local weather, or text to search the site. » advanced search
Watch desert floodwaters gushing towards Lake Eyre
15:00 AEST Spectacular animated satellite imagery shows the movement of floodwaters from outback Queensland towards South Australia, with the waters bound for the normally dry Kati Thanda–Lake Eyre.