- WEATHER
Australia
- National
- New South Wales
- Victoria
- Queensland
- Western Australia
- South Australia
- Tasmania
- ACT
- Northern Territory
Long Range Forecasts
- WARNINGS
- RADAR
- SATELLITE
- MAPS & CHARTS
- LONG RANGE
Long Range Forecasts
- CLIMATE
Climate Indicators
- NEWS
Penrith Long-term Averages
| Jan | Feb | Mar | Apr | May | Jun | Jul | Aug | Sep | Oct | Nov | Dec | Ann | |
|---|---|---|---|---|---|---|---|---|---|---|---|---|---|
| Mean Max (°C) |
30.8 | 29.6 | 27.6 | 24.6 | 21.2 | 18.2 | 18.0 | 20.1 | 23.5 | 25.9 | 27.5 | 29.8 | 24.7 |
| Mean Min (°C) |
18.6 | 18.5 | 16.9 | 13.1 | 9.1 | 6.8 | 5.4 | 6.3 | 9.3 | 12.3 | 15.0 | 17.1 | 12.4 |
| Mean Rain (mm) |
94.2 | 121.3 | 104.7 | 57.6 | 32.1 | 51.6 | 38.1 | 31.2 | 31.9 | 53.3 | 81.7 | 64.9 | 763.4 |
| Median Rain (mm) |
91.0 | 136.2 | 46.4 | 19.0 | 24.8 | 25.1 | 26.6 | 18.8 | 25.4 | 39.6 | 57.5 | 55.1 | 669.8 |
| Mean Rain Days |
12.2 | 12.3 | 12.3 | 10.0 | 10.4 | 14.1 | 11.9 | 8.4 | 8.1 | 9.4 | 11.9 | 10.9 | 130.9 |
Penrith Daily Records
| Jan | Feb | Mar | Apr | May | Jun | Jul | Aug | Sep | Oct | Nov | Dec | Ann | |
|---|---|---|---|---|---|---|---|---|---|---|---|---|---|
| High Max (°C) |
48.9 | 46.9 | 40.6 | 36.6 | 29.4 | 26.0 | 28.2 | 30.3 | 37.3 | 38.9 | 44.9 | 46.3 | 48.9 |
| Low Max (°C) |
18.8 | 18.2 | 16.8 | 14.6 | 13.1 | 8.3 | 11.2 | 12.3 | 12.9 | 14.2 | 13.6 | 16.5 | 8.3 |
| High Min (°C) |
25.5 | 26.2 | 23.3 | 21.9 | 17.9 | 14.6 | 13.9 | 14.6 | 17.5 | 20.9 | 24.9 | 25.3 | 26.2 |
| Low Min (°C) |
10.6 | 11.6 | 8.3 | 3.6 | 0.6 | -1.1 | -1.8 | -1.6 | 2.2 | 5.0 | 6.8 | 9.8 | -1.8 |
| High Rain (mm) |
101.8 | 139.0 | 130.6 | 167.0 | 63.0 | 81.6 | 101.6 | 60.6 | 57.2 | 75.2 | 89.0 | 49.6 | 167.0 |
Penrith Monthly Records
| Jan | Feb | Mar | Apr | May | Jun | Jul | Aug | Sep | Oct | Nov | Dec | Ann | |
|---|---|---|---|---|---|---|---|---|---|---|---|---|---|
| High Mn. Max (°C) |
34.8 | 32.7 | 30.5 | 28.6 | 23.5 | 20.1 | 20.4 | 21.9 | 26.4 | 28.9 | 31.8 | 33.5 | 26.3 |
| Low Mn. Max (°C) |
27.4 | 26.0 | 25.7 | 21.8 | 19.7 | 16.7 | 16.1 | 18.2 | 20.7 | 23.0 | 23.8 | 24.8 | 23.6 |
| High Mn. Min (°C) |
20.6 | 19.8 | 18.8 | 15.5 | 11.2 | 9.3 | 7.3 | 9.2 | 10.5 | 14.2 | 17.0 | 18.8 | 13.3 |
| Low Mn. Min (°C) |
16.0 | 16.3 | 15.4 | 10.8 | 6.1 | 4.5 | 3.4 | 4.0 | 7.8 | 11.0 | 12.5 | 14.8 | 11.6 |
| High Rain (mm) |
307.8 | 356.8 | 592.8 | 264.0 | 96.0 | 226.0 | 259.2 | 161.2 | 93.6 | 256.2 | 233.4 | 164.2 | 1512.6 |
| Low Rain (mm) |
19.2 | 1.8 | 3.8 | 1.8 | 3.2 | 2.0 | 1.4 | 0.0 | 0.2 | 4.6 | 13.0 | 0.0 | 450.0 |
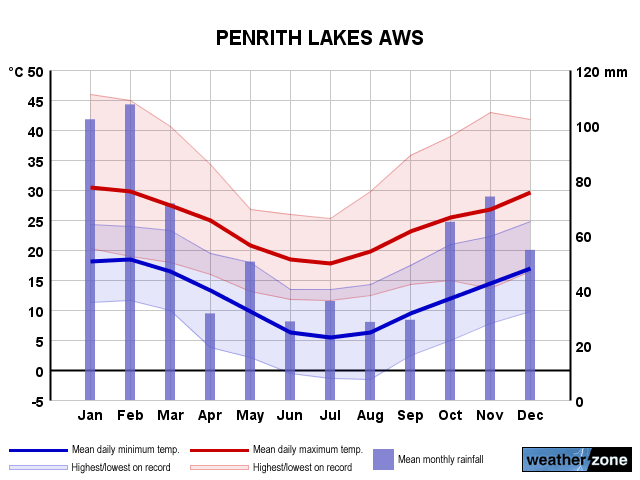
Penrith Annual Temperatures & Rainfall
Penrith Average Number of Days With Temperatures
| Jan | Feb | Mar | Apr | May | Jun | Jul | Aug | Sep | Oct | Nov | Dec | Ann | |
|---|---|---|---|---|---|---|---|---|---|---|---|---|---|
| ≥ 40°C |
2.2 | 0.8 | 0.1 | 0.0 | 0.0 | 0.0 | 0.0 | 0.0 | 0.0 | 0.0 | 0.5 | 1.0 | 4.8 |
| ≥ 35°C |
6.9 | 3.8 | 1.3 | 0.1 | 0.0 | 0.0 | 0.0 | 0.0 | 0.2 | 1.1 | 3.0 | 5.2 | 22.0 |
| ≥ 30°C |
16.2 | 12.8 | 8.0 | 1.5 | 0.0 | 0.0 | 0.0 | 0.0 | 2.4 | 6.7 | 9.0 | 14.8 | 71.8 |
| ≤ 2°C |
0.0 | 0.0 | 0.0 | 0.0 | 0.1 | 2.0 | 4.4 | 2.0 | 0.0 | 0.0 | 0.0 | 0.0 | 8.3 |
| ≤ 0°C |
0.0 | 0.0 | 0.0 | 0.0 | 0.0 | 0.2 | 0.3 | 0.1 | 0.0 | 0.0 | 0.0 | 0.0 | 0.6 |
Penrith 'per Week' Values (14th/86th Percentiles)
| Jan | Feb | Mar | Apr | May | Jun | Jul | Aug | Sep | Oct | Nov | Dec | Ann | |
|---|---|---|---|---|---|---|---|---|---|---|---|---|---|
| High Max |
36.8 | 34.6 | 31.2 | 28.1 | 23.6 | 20.3 | 19.8 | 22.9 | 28.0 | 31.6 | 33.6 | 34.9 | 31.3 |
| Low Max |
24.5 | 24.1 | 23.5 | 20.8 | 18.4 | 15.9 | 15.4 | 17.1 | 18.9 | 20.4 | 20.8 | 23.9 | 18.1 |
| High Min |
20.8 | 20.9 | 19.3 | 15.8 | 13.3 | 10.9 | 9.1 | 10.1 | 12.7 | 15.4 | 18.0 | 19.3 | 18.4 |
| Low Min |
15.9 | 15.7 | 14.0 | 9.9 | 5.5 | 2.8 | 2.2 | 2.8 | 6.1 | 8.5 | 11.7 | 14.3 | 5.6 |
Penrith Data Availability
| Jan | Feb | Mar | Apr | May | Jun | Jul | Aug | Sep | Oct | Nov | Dec | Ann | |
|---|---|---|---|---|---|---|---|---|---|---|---|---|---|
| Years of Minima |
29 | 29 | 28 | 29 | 28 | 28 | 27 | 27 | 28 | 29 | 30 | 29 | 29.0 |
| Earliest Entry |
1996 | 1996 | 1996 | 1996 | 1996 | 1996 | 1996 | 1996 | 1995 | 1995 | 1995 | 1995 | 1995 |
| Latest Entry |
2025 | 2025 | 2025 | 2024 | 2024 | 2024 | 2024 | 2024 | 2024 | 2024 | 2024 | 2024 | 2025 |
| Years of Maxima |
29 | 29 | 29 | 28 | 29 | 29 | 29 | 27 | 29 | 30 | 30 | 29 | 29.0 |
| Earliest Entry |
1996 | 1996 | 1996 | 1996 | 1996 | 1996 | 1996 | 1996 | 1995 | 1995 | 1995 | 1995 | 1995 |
| Latest Entry |
2025 | 2025 | 2025 | 2024 | 2024 | 2024 | 2024 | 2024 | 2024 | 2024 | 2024 | 2024 | 2025 |
| Years of Rainfall |
30 | 29 | 29 | 29 | 28 | 29 | 28 | 27 | 28 | 29 | 30 | 29 | 29.0 |
| Earliest Entry |
1996 | 1996 | 1996 | 1996 | 1996 | 1996 | 1996 | 1996 | 1995 | 1995 | 1995 | 1995 | 1995 |
| Latest Entry |
2025 | 2025 | 2025 | 2024 | 2024 | 2024 | 2024 | 2024 | 2024 | 2024 | 2024 | 2024 | 2025 |
Station Details
PENRITH LAKES AWS
Sydney, New South Wales/ACT
Sydney, New South Wales/ACT
33.7195°S 150.6783°E
25m AMSL
Commenced 1995
Commenced 1995
Enter a postcode or town name for local weather, or text to search the site. » advanced search
Strong positive SAM influencing Australia's weather ? here's what to expect
17:43 AEST This week’s weather patterns across Australia will be influenced by a strong positive Southern Annular Mode (SAM), increasing the likelihood of rain in some parts of the country and bringing a week of dry weather to others.