- WEATHER
Australia
- National
- New South Wales
- Victoria
- Queensland
- Western Australia
- South Australia
- Tasmania
- ACT
- Northern Territory
Long Range Forecasts
- WARNINGS
- RADAR
- SATELLITE
- MAPS & CHARTS
- LONG RANGE
Long Range Forecasts
- CLIMATE
Climate Indicators
- NEWS
Braidwood Long-term Averages
| Jan | Feb | Mar | Apr | May | Jun | Jul | Aug | Sep | Oct | Nov | Dec | Ann | |
|---|---|---|---|---|---|---|---|---|---|---|---|---|---|
| Mean Max (°C) |
26.9 | 25.4 | 22.8 | 19.5 | 15.9 | 12.6 | 12.2 | 13.6 | 16.6 | 19.3 | 22.3 | 24.8 | 19.2 |
| Mean Min (°C) |
12.4 | 12.4 | 10.1 | 6.1 | 2.8 | 1.2 | 0.2 | 0.8 | 3.3 | 5.7 | 8.5 | 10.6 | 6.1 |
| Mean Rain (mm) |
65.9 | 64.7 | 65.5 | 43.7 | 40.1 | 59.7 | 33.3 | 55.0 | 51.0 | 57.2 | 84.1 | 69.1 | 682.3 |
| Median Rain (mm) |
39.3 | 36.4 | 42.4 | 25.6 | 22.5 | 29.8 | 20.2 | 33.4 | 48.6 | 53.2 | 72.6 | 50.8 | 585.3 |
| Mean Rain Days |
12.6 | 11.7 | 13.1 | 11.3 | 12.3 | 14.4 | 13.3 | 11.4 | 11.0 | 11.3 | 12.7 | 11.5 | 145.1 |
Braidwood Daily Records
| Jan | Feb | Mar | Apr | May | Jun | Jul | Aug | Sep | Oct | Nov | Dec | Ann | |
|---|---|---|---|---|---|---|---|---|---|---|---|---|---|
| High Max (°C) |
42.6 | 42.0 | 36.6 | 31.4 | 24.6 | 20.3 | 18.5 | 22.3 | 28.8 | 31.4 | 39.2 | 40.4 | 42.6 |
| Low Max (°C) |
14.0 | 13.0 | 12.6 | 8.8 | 5.3 | 5.6 | 5.6 | 5.5 | 8.0 | 7.7 | 9.0 | 11.2 | 5.3 |
| High Min (°C) |
23.1 | 21.5 | 19.2 | 17.2 | 14.5 | 12.4 | 10.6 | 11.4 | 14.1 | 16.3 | 20.0 | 20.6 | 23.1 |
| Low Min (°C) |
1.2 | 1.7 | -0.6 | -5.6 | -7.6 | -9.3 | -9.2 | -9.8 | -6.7 | -6.5 | -2.9 | -0.4 | -9.8 |
| High Rain (mm) |
65.8 | 70.0 | 70.0 | 128.4 | 64.0 | 87.6 | 59.6 | 83.8 | 61.6 | 72.0 | 97.0 | 58.6 | 128.4 |
Braidwood Monthly Records
| Jan | Feb | Mar | Apr | May | Jun | Jul | Aug | Sep | Oct | Nov | Dec | Ann | |
|---|---|---|---|---|---|---|---|---|---|---|---|---|---|
| High Mn. Max (°C) |
30.5 | 28.2 | 25.3 | 23.3 | 17.6 | 14.2 | 14.5 | 15.9 | 21.0 | 22.7 | 26.5 | 28.9 | 21.1 |
| Low Mn. Max (°C) |
22.4 | 21.9 | 19.9 | 17.6 | 14.1 | 10.9 | 10.3 | 11.3 | 14.7 | 16.9 | 18.4 | 20.1 | 17.6 |
| High Mn. Min (°C) |
16.0 | 15.4 | 13.2 | 9.0 | 7.5 | 5.8 | 2.9 | 3.6 | 5.7 | 8.4 | 11.2 | 13.2 | 7.3 |
| Low Mn. Min (°C) |
8.9 | 10.8 | 7.4 | 3.0 | -0.2 | -1.5 | -3.2 | -2.5 | -0.7 | 3.1 | 5.0 | 7.7 | 4.6 |
| High Rain (mm) |
167.2 | 198.6 | 240.6 | 254.8 | 142.4 | 219.2 | 108.2 | 212.4 | 125.4 | 171.6 | 241.4 | 212.8 | 1255.2 |
| Low Rain (mm) |
4.8 | 2.2 | 0.8 | 0.6 | 1.8 | 1.2 | 4.6 | 0.8 | 13.6 | 3.0 | 9.8 | 0.6 | 416.4 |
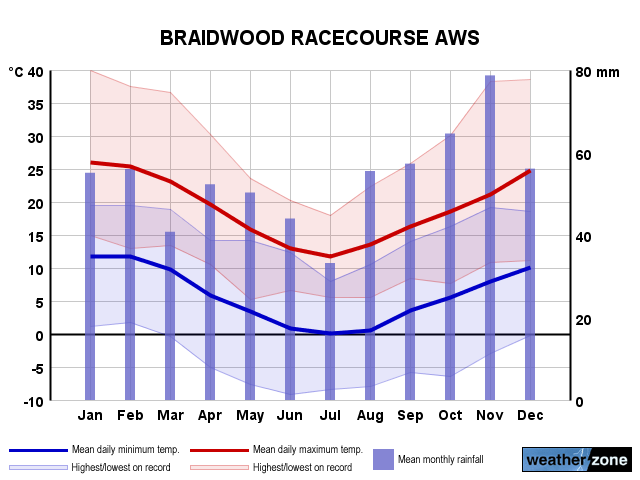
Braidwood Annual Temperatures & Rainfall
Braidwood Average Number of Days With Temperatures
| Jan | Feb | Mar | Apr | May | Jun | Jul | Aug | Sep | Oct | Nov | Dec | Ann | |
|---|---|---|---|---|---|---|---|---|---|---|---|---|---|
| ≥ 40°C |
0.1 | 0.0 | 0.0 | 0.0 | 0.0 | 0.0 | 0.0 | 0.0 | 0.0 | 0.0 | 0.0 | 0.0 | 0.2 |
| ≥ 35°C |
2.7 | 1.0 | 0.0 | 0.0 | 0.0 | 0.0 | 0.0 | 0.0 | 0.0 | 0.0 | 0.3 | 0.8 | 4.7 |
| ≥ 30°C |
9.6 | 5.5 | 1.8 | 0.1 | 0.0 | 0.0 | 0.0 | 0.0 | 0.0 | 0.2 | 2.4 | 5.4 | 24.6 |
| ≤ 2°C |
0.1 | 0.0 | 0.4 | 4.9 | 13.8 | 16.3 | 20.1 | 18.1 | 12.0 | 6.1 | 1.8 | 0.4 | 93.5 |
| ≤ 0°C |
0.0 | 0.0 | 0.1 | 1.9 | 9.2 | 11.6 | 14.7 | 12.9 | 6.9 | 2.7 | 0.5 | 0.1 | 60.4 |
Braidwood 'per Week' Values (14th/86th Percentiles)
| Jan | Feb | Mar | Apr | May | Jun | Jul | Aug | Sep | Oct | Nov | Dec | Ann | |
|---|---|---|---|---|---|---|---|---|---|---|---|---|---|
| High Max |
33.5 | 31.6 | 28.2 | 23.8 | 19.1 | 15.2 | 14.2 | 16.6 | 20.5 | 23.9 | 27.9 | 30.6 | 26.6 |
| Low Max |
20.5 | 19.6 | 18.1 | 15.4 | 12.9 | 10.1 | 9.7 | 10.3 | 12.4 | 14.5 | 16.0 | 18.5 | 12.2 |
| High Min |
15.8 | 15.9 | 13.6 | 9.9 | 8.0 | 6.1 | 4.9 | 5.4 | 7.9 | 9.9 | 12.4 | 14.0 | 12.6 |
| Low Min |
7.6 | 8.3 | 5.6 | 1.0 | -2.4 | -4.1 | -4.5 | -4.5 | -1.4 | 0.8 | 3.4 | 6.4 | -0.9 |
Braidwood Data Availability
| Jan | Feb | Mar | Apr | May | Jun | Jul | Aug | Sep | Oct | Nov | Dec | Ann | |
|---|---|---|---|---|---|---|---|---|---|---|---|---|---|
| Years of Minima |
34 | 32 | 32 | 34 | 34 | 34 | 33 | 35 | 34 | 36 | 33 | 34 | 34.0 |
| Earliest Entry |
1991 | 1991 | 1991 | 1991 | 1991 | 1991 | 1990 | 1985 | 1985 | 1985 | 1985 | 1985 | 1985 |
| Latest Entry |
2025 | 2025 | 2025 | 2024 | 2024 | 2024 | 2024 | 2024 | 2024 | 2024 | 2024 | 2024 | 2025 |
| Years of Maxima |
34 | 33 | 32 | 33 | 34 | 34 | 33 | 35 | 34 | 34 | 33 | 34 | 34.0 |
| Earliest Entry |
1991 | 1991 | 1991 | 1991 | 1991 | 1991 | 1990 | 1985 | 1985 | 1985 | 1985 | 1985 | 1985 |
| Latest Entry |
2025 | 2025 | 2025 | 2024 | 2024 | 2024 | 2024 | 2024 | 2024 | 2024 | 2024 | 2024 | 2025 |
| Years of Rainfall |
33 | 31 | 32 | 31 | 31 | 31 | 30 | 34 | 33 | 34 | 33 | 33 | 31.0 |
| Earliest Entry |
1986 | 1986 | 1986 | 1986 | 1986 | 1986 | 1986 | 1985 | 1985 | 1985 | 1985 | 1985 | 1985 |
| Latest Entry |
2025 | 2025 | 2025 | 2024 | 2024 | 2024 | 2024 | 2024 | 2024 | 2024 | 2024 | 2024 | 2025 |
Station Details
BRAIDWOOD RACECOURSE AWS
Southern Tablelands, New South Wales/ACT
Southern Tablelands, New South Wales/ACT
35.4253°S 149.7835°E
666m AMSL
Commenced 1985
Commenced 1985
Enter a postcode or town name for local weather, or text to search the site. » advanced search
High chance of tropical cyclone near Australia next week
12:03 AEST A late-season tropical cyclone could form near northern Australia next week, which would make this Australia’s most active cyclone season in six years.