- WEATHER
Australia
- National
- New South Wales
- Victoria
- Queensland
- Western Australia
- South Australia
- Tasmania
- ACT
- Northern Territory
Long Range Forecasts
- WARNINGS
- RADAR
- SATELLITE
- MAPS & CHARTS
- LONG RANGE
Long Range Forecasts
- CLIMATE
Climate Indicators
- NEWS
Moruya Ap Long-term Averages
| Jan | Feb | Mar | Apr | May | Jun | Jul | Aug | Sep | Oct | Nov | Dec | Ann | |
|---|---|---|---|---|---|---|---|---|---|---|---|---|---|
| Mean Max (°C) |
25.4 | 24.8 | 24.0 | 22.1 | 19.8 | 17.5 | 17.3 | 18.2 | 20.4 | 21.6 | 22.5 | 23.9 | 21.4 |
| Mean Min (°C) |
16.2 | 16.2 | 14.4 | 11.2 | 7.4 | 5.6 | 4.1 | 4.6 | 7.0 | 9.7 | 12.4 | 14.4 | 10.2 |
| Mean Rain (mm) |
74.7 | 102.6 | 96.9 | 61.1 | 50.1 | 73.9 | 51.1 | 54.6 | 39.6 | 78.4 | 87.5 | 81.0 | 845.3 |
| Median Rain (mm) |
34.4 | 75.6 | 53.8 | 34.0 | 22.6 | 35.6 | 31.7 | 23.2 | 34.5 | 36.5 | 68.1 | 47.3 | 702.0 |
| Mean Rain Days |
12.4 | 12.5 | 13.2 | 9.5 | 8.5 | 9.7 | 8.1 | 7.3 | 9.4 | 11.1 | 12.5 | 12.9 | 125.2 |
Moruya Ap Daily Records
| Jan | Feb | Mar | Apr | May | Jun | Jul | Aug | Sep | Oct | Nov | Dec | Ann | |
|---|---|---|---|---|---|---|---|---|---|---|---|---|---|
| High Max (°C) |
45.9 | 42.1 | 38.9 | 35.4 | 28.7 | 25.0 | 25.7 | 28.1 | 36.6 | 38.0 | 42.0 | 43.0 | 45.9 |
| Low Max (°C) |
16.9 | 17.2 | 17.9 | 15.0 | 12.0 | 11.0 | 11.0 | 11.0 | 12.0 | 12.8 | 14.0 | 16.6 | 11.0 |
| High Min (°C) |
22.4 | 22.5 | 21.2 | 19.0 | 18.7 | 15.1 | 13.7 | 15.0 | 19.0 | 20.0 | 19.6 | 21.2 | 22.5 |
| Low Min (°C) |
6.0 | 6.5 | 3.8 | 1.0 | -2.0 | -3.0 | -4.0 | -2.1 | -2.0 | -1.0 | 3.0 | 4.0 | -4.0 |
| High Rain (mm) |
124.8 | 153.0 | 109.0 | 115.0 | 118.6 | 136.2 | 116.0 | 115.0 | 75.0 | 113.8 | 125.0 | 79.0 | 153.0 |
Moruya Ap Monthly Records
| Jan | Feb | Mar | Apr | May | Jun | Jul | Aug | Sep | Oct | Nov | Dec | Ann | |
|---|---|---|---|---|---|---|---|---|---|---|---|---|---|
| High Mn. Max (°C) |
27.2 | 26.4 | 25.1 | 23.6 | 21.8 | 19.0 | 18.8 | 20.6 | 23.0 | 24.0 | 25.3 | 26.4 | 22.3 |
| Low Mn. Max (°C) |
23.7 | 22.8 | 22.4 | 20.8 | 18.8 | 16.0 | 15.8 | 16.9 | 18.5 | 19.6 | 20.3 | 21.7 | 20.7 |
| High Mn. Min (°C) |
18.7 | 17.6 | 16.6 | 12.9 | 9.6 | 7.4 | 6.3 | 7.3 | 9.1 | 12.0 | 14.7 | 16.7 | 11.6 |
| Low Mn. Min (°C) |
13.8 | 15.0 | 12.7 | 7.9 | 5.5 | 3.3 | 2.3 | 2.7 | 4.8 | 7.7 | 9.9 | 12.6 | 9.3 |
| High Rain (mm) |
280.6 | 385.2 | 313.8 | 193.4 | 247.6 | 317.2 | 274.4 | 214.2 | 124.2 | 254.0 | 237.8 | 251.8 | 1379.2 |
| Low Rain (mm) |
13.2 | 18.0 | 16.0 | 6.2 | 9.0 | 1.8 | 1.2 | 2.0 | 1.0 | 1.6 | 11.6 | 8.8 | 450.8 |
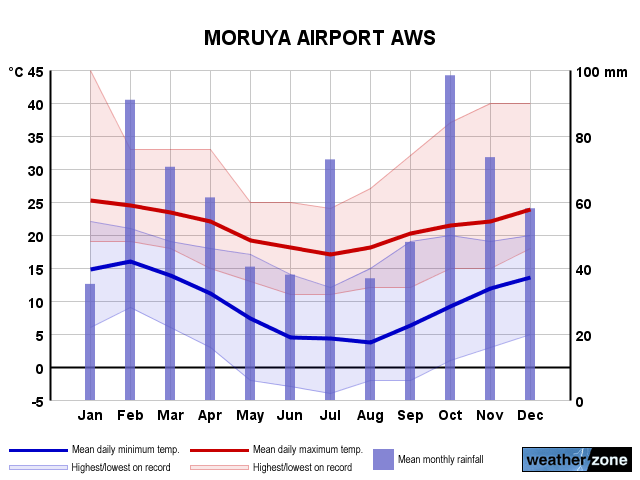
Moruya Ap Annual Temperatures & Rainfall
Moruya Ap Average Number of Days With Temperatures
| Jan | Feb | Mar | Apr | May | Jun | Jul | Aug | Sep | Oct | Nov | Dec | Ann | |
|---|---|---|---|---|---|---|---|---|---|---|---|---|---|
| ≥ 40°C |
0.3 | 0.1 | 0.0 | 0.0 | 0.0 | 0.0 | 0.0 | 0.0 | 0.0 | 0.0 | 0.2 | 0.1 | 0.7 |
| ≥ 35°C |
0.9 | 0.5 | 0.1 | 0.1 | 0.0 | 0.0 | 0.0 | 0.0 | 0.1 | 0.6 | 0.7 | 0.8 | 3.9 |
| ≥ 30°C |
2.2 | 0.9 | 0.8 | 0.5 | 0.0 | 0.0 | 0.0 | 0.0 | 1.0 | 2.2 | 2.0 | 1.9 | 11.6 |
| ≤ 2°C |
0.0 | 0.0 | 0.0 | 0.2 | 2.1 | 5.8 | 10.6 | 9.3 | 3.0 | 0.4 | 0.0 | 0.0 | 31.2 |
| ≤ 0°C |
0.0 | 0.0 | 0.0 | 0.0 | 0.2 | 1.5 | 4.0 | 3.6 | 0.8 | 0.0 | 0.0 | 0.0 | 10.2 |
Moruya Ap 'per Week' Values (14th/86th Percentiles)
| Jan | Feb | Mar | Apr | May | Jun | Jul | Aug | Sep | Oct | Nov | Dec | Ann | |
|---|---|---|---|---|---|---|---|---|---|---|---|---|---|
| High Max |
27.3 | 27.0 | 26.0 | 24.0 | 22.0 | 20.0 | 19.0 | 21.0 | 26.0 | 26.0 | 25.5 | 26.0 | 25.0 |
| Low Max |
22.0 | 22.0 | 21.0 | 19.0 | 17.0 | 16.0 | 15.0 | 16.0 | 17.0 | 18.0 | 19.0 | 21.0 | 17.0 |
| High Min |
18.0 | 19.0 | 17.0 | 14.0 | 11.0 | 10.0 | 9.0 | 9.0 | 11.0 | 13.0 | 16.0 | 17.0 | 16.0 |
| Low Min |
12.0 | 13.0 | 10.0 | 7.0 | 3.0 | 1.0 | 0.0 | 0.0 | 2.0 | 5.0 | 8.0 | 10.0 | 3.0 |
Moruya Ap Data Availability
| Jan | Feb | Mar | Apr | May | Jun | Jul | Aug | Sep | Oct | Nov | Dec | Ann | |
|---|---|---|---|---|---|---|---|---|---|---|---|---|---|
| Years of Minima |
25 | 25 | 24 | 24 | 23 | 24 | 24 | 25 | 25 | 26 | 26 | 26 | 25.0 |
| Earliest Entry |
2000 | 2000 | 2000 | 2000 | 2000 | 2000 | 2000 | 2000 | 2000 | 1999 | 1999 | 1999 | 1999 |
| Latest Entry |
2025 | 2025 | 2025 | 2024 | 2024 | 2024 | 2024 | 2024 | 2024 | 2024 | 2024 | 2024 | 2025 |
| Years of Maxima |
25 | 25 | 24 | 24 | 23 | 25 | 25 | 25 | 25 | 26 | 26 | 26 | 25.0 |
| Earliest Entry |
2000 | 2000 | 2000 | 2000 | 2000 | 2000 | 2000 | 2000 | 2000 | 1999 | 1999 | 1999 | 1999 |
| Latest Entry |
2025 | 2025 | 2025 | 2024 | 2024 | 2024 | 2024 | 2024 | 2024 | 2024 | 2024 | 2024 | 2025 |
| Years of Rainfall |
25 | 25 | 24 | 23 | 23 | 25 | 25 | 24 | 25 | 26 | 26 | 26 | 25.0 |
| Earliest Entry |
2000 | 2000 | 2000 | 2000 | 2000 | 2000 | 2000 | 2000 | 2000 | 1999 | 1999 | 1999 | 1999 |
| Latest Entry |
2025 | 2025 | 2025 | 2024 | 2024 | 2024 | 2024 | 2024 | 2024 | 2024 | 2024 | 2024 | 2025 |
Station Details
MORUYA AIRPORT AWS
South Coast, New South Wales/ACT
South Coast, New South Wales/ACT
35.9004°S 150.1437°E
4m AMSL
Commenced 1999
Commenced 1999
Enter a postcode or town name for local weather, or text to search the site. » advanced search
Mid-autumn hot spell for Melbourne, Adelaide
11:17 AEST Significant mid-autumn heat is heading the way of southeastern Australia this weekend, with Melbourne and Adelaide the main capital cities set to be affected.