- WEATHER
Australia
- National
- New South Wales
- Victoria
- Queensland
- Western Australia
- South Australia
- Tasmania
- ACT
- Northern Territory
Long Range Forecasts
- WARNINGS
- RADAR
- SATELLITE
- MAPS & CHARTS
- LONG RANGE
Long Range Forecasts
- CLIMATE
Climate Indicators
- NEWS
Beverley Long-term Averages
| Jan | Feb | Mar | Apr | May | Jun | Jul | Aug | Sep | Oct | Nov | Dec | Ann | |
|---|---|---|---|---|---|---|---|---|---|---|---|---|---|
| Mean Max (°C) |
34.4 | 33.8 | 30.8 | 26.2 | 21.5 | 18.0 | 16.9 | 17.8 | 20.5 | 24.7 | 28.8 | 32.4 | 25.4 |
| Mean Min (°C) |
16.3 | 16.7 | 14.8 | 11.3 | 7.9 | 6.0 | 5.1 | 5.1 | 5.9 | 8.0 | 11.6 | 14.4 | 10.2 |
| Mean Rain (mm) |
13.5 | 14.6 | 17.0 | 23.5 | 53.5 | 76.6 | 77.2 | 58.1 | 34.0 | 23.2 | 15.0 | 9.8 | 419.5 |
| Median Rain (mm) |
1.8 | 3.2 | 7.4 | 18.5 | 45.0 | 75.2 | 66.1 | 55.0 | 32.7 | 19.1 | 10.6 | 2.8 | 409.3 |
| Mean Rain Days |
2.1 | 2.3 | 3.2 | 5.4 | 10.0 | 13.4 | 15.0 | 13.3 | 10.0 | 6.8 | 3.9 | 2.4 | 88.3 |
Beverley Daily Records
| Jan | Feb | Mar | Apr | May | Jun | Jul | Aug | Sep | Oct | Nov | Dec | Ann | |
|---|---|---|---|---|---|---|---|---|---|---|---|---|---|
| High Max (°C) |
46.4 | 46.8 | 42.8 | 39.0 | 34.8 | 25.7 | 25.3 | 28.8 | 34.8 | 39.4 | 43.0 | 45.2 | 46.8 |
| Low Max (°C) |
17.4 | 15.4 | 15.4 | 14.0 | 10.2 | 10.4 | 9.2 | 11.2 | 10.7 | 11.2 | 12.0 | 16.8 | 9.2 |
| High Min (°C) |
28.2 | 27.6 | 26.7 | 22.2 | 18.6 | 16.8 | 14.2 | 15.2 | 15.2 | 19.0 | 26.8 | 26.4 | 28.2 |
| Low Min (°C) |
6.6 | 6.9 | 2.6 | 0.5 | -1.8 | -3.6 | -3.8 | -2.6 | -2.6 | -1.0 | -1.1 | 4.2 | -3.8 |
| High Rain (mm) |
115.8 | 99.4 | 91.7 | 55.4 | 87.6 | 61.2 | 63.2 | 67.4 | 33.0 | 69.7 | 63.6 | 51.3 | 115.8 |
Beverley Monthly Records
| Jan | Feb | Mar | Apr | May | Jun | Jul | Aug | Sep | Oct | Nov | Dec | Ann | |
|---|---|---|---|---|---|---|---|---|---|---|---|---|---|
| High Mn. Max (°C) |
36.9 | 37.6 | 33.5 | 29.5 | 24.1 | 20.5 | 19.2 | 20.5 | 23.6 | 29.1 | 32.8 | 37.3 | 26.8 |
| Low Mn. Max (°C) |
30.4 | 30.0 | 27.8 | 22.8 | 19.1 | 15.1 | 15.0 | 16.0 | 17.4 | 21.4 | 24.0 | 28.7 | 23.6 |
| High Mn. Min (°C) |
18.6 | 19.6 | 17.3 | 14.6 | 11.4 | 8.5 | 7.9 | 7.7 | 8.3 | 10.4 | 14.4 | 17.1 | 11.5 |
| Low Mn. Min (°C) |
14.7 | 13.8 | 12.6 | 8.6 | 4.6 | 2.0 | 1.8 | 2.3 | 3.6 | 5.5 | 8.5 | 11.2 | 9.0 |
| High Rain (mm) |
155.5 | 174.3 | 131.3 | 90.8 | 145.7 | 255.9 | 216.1 | 180.7 | 84.3 | 120.1 | 80.8 | 96.1 | 617.3 |
| Low Rain (mm) |
0.0 | 0.0 | 0.0 | 0.0 | 1.3 | 6.0 | 13.4 | 5.2 | 1.8 | 0.0 | 0.0 | 0.0 | 216.0 |
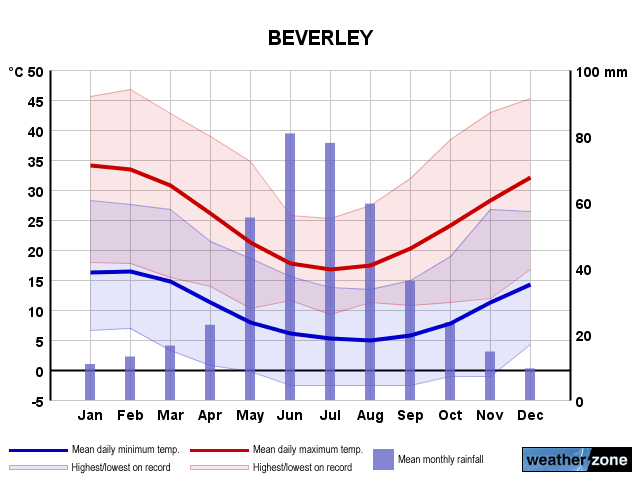
Beverley Annual Temperatures & Rainfall
Beverley Average Number of Days With Temperatures
| Jan | Feb | Mar | Apr | May | Jun | Jul | Aug | Sep | Oct | Nov | Dec | Ann | |
|---|---|---|---|---|---|---|---|---|---|---|---|---|---|
| ≥ 40°C |
4.1 | 3.0 | 0.6 | 0.0 | 0.0 | 0.0 | 0.0 | 0.0 | 0.0 | 0.0 | 0.3 | 2.1 | 9.8 |
| ≥ 35°C |
14.3 | 11.6 | 6.4 | 0.8 | 0.0 | 0.0 | 0.0 | 0.0 | 0.0 | 0.7 | 3.9 | 9.6 | 46.8 |
| ≥ 30°C |
25.6 | 22.2 | 17.4 | 5.7 | 0.4 | 0.0 | 0.0 | 0.0 | 0.3 | 4.3 | 11.9 | 21.1 | 108.0 |
| ≤ 2°C |
0.0 | 0.0 | 0.0 | 0.1 | 1.7 | 5.3 | 7.3 | 7.4 | 4.7 | 1.5 | 0.1 | 0.0 | 28.0 |
| ≤ 0°C |
0.0 | 0.0 | 0.0 | 0.0 | 0.1 | 1.6 | 2.8 | 1.9 | 1.1 | 0.2 | 0.0 | 0.0 | 7.7 |
Beverley 'per Week' Values (14th/86th Percentiles)
| Jan | Feb | Mar | Apr | May | Jun | Jul | Aug | Sep | Oct | Nov | Dec | Ann | |
|---|---|---|---|---|---|---|---|---|---|---|---|---|---|
| High Max |
39.4 | 38.7 | 36.4 | 30.8 | 25.0 | 20.6 | 19.1 | 20.2 | 23.7 | 29.4 | 34.3 | 37.4 | 34.2 |
| Low Max |
29.1 | 28.4 | 25.7 | 21.6 | 17.9 | 15.3 | 14.4 | 15.1 | 17.0 | 19.7 | 23.2 | 26.8 | 17.0 |
| High Min |
19.5 | 20.0 | 18.4 | 15.5 | 12.4 | 10.3 | 9.3 | 9.3 | 9.9 | 12.0 | 15.2 | 17.7 | 16.5 |
| Low Min |
13.0 | 13.2 | 10.8 | 6.7 | 3.6 | 1.5 | 0.8 | 1.0 | 1.8 | 3.6 | 7.5 | 10.9 | 3.6 |
Beverley Data Availability
| Jan | Feb | Mar | Apr | May | Jun | Jul | Aug | Sep | Oct | Nov | Dec | Ann | |
|---|---|---|---|---|---|---|---|---|---|---|---|---|---|
| Years of Minima |
56 | 55 | 56 | 55 | 55 | 55 | 55 | 55 | 54 | 54 | 56 | 56 | 55.0 |
| Earliest Entry |
1969 | 1969 | 1969 | 1969 | 1969 | 1969 | 1969 | 1969 | 1969 | 1968 | 1968 | 1968 | 1968 |
| Latest Entry |
2024 | 2024 | 2024 | 2024 | 2023 | 2023 | 2023 | 2023 | 2023 | 2023 | 2023 | 2023 | 2024 |
| Years of Maxima |
55 | 55 | 56 | 55 | 54 | 54 | 55 | 55 | 53 | 53 | 55 | 55 | 54.0 |
| Earliest Entry |
1969 | 1969 | 1969 | 1969 | 1969 | 1969 | 1969 | 1969 | 1969 | 1968 | 1968 | 1968 | 1968 |
| Latest Entry |
2024 | 2024 | 2024 | 2024 | 2023 | 2023 | 2023 | 2023 | 2023 | 2023 | 2023 | 2023 | 2024 |
| Years of Rainfall |
125 | 126 | 121 | 119 | 117 | 117 | 117 | 117 | 117 | 116 | 119 | 121 | 117.0 |
| Earliest Entry |
1886 | 1889 | 1890 | 1891 | 1907 | 1907 | 1907 | 1907 | 1907 | 1907 | 1890 | 1886 | 1886 |
| Latest Entry |
2024 | 2024 | 2024 | 2024 | 2023 | 2023 | 2023 | 2023 | 2023 | 2023 | 2023 | 2023 | 2024 |
Station Details
BEVERLEY
Central Wheatbelt, Western Australia
Central Wheatbelt, Western Australia
32.1083°S 116.9247°E
199m AMSL
Commenced 1886
Commenced 1886
Enter a postcode or town name for local weather, or text to search the site. » advanced search
A very wet weekend ahead for NSW
14:35 AEST Rainfall is set to intensify over the weekend and early next week, with hundreds of millimetres in just three days possible across parts of the central NSW coastline. The heavy rainfall forecast at the end of this week will follow a prolonged period of rainfall which began on Tuesday, generated by a coastal trough lingering off the NSW coast for days. Nord’s Wharf Oval in the Hunter Valley recorded 93mm in the 24 hours leading up to 9am Wednesday, May 5.