- WEATHER
Australia
- National
- New South Wales
- Victoria
- Queensland
- Western Australia
- South Australia
- Tasmania
- ACT
- Northern Territory
Long Range Forecasts
- WARNINGS
- RADAR
- SATELLITE
- MAPS & CHARTS
- LONG RANGE
Long Range Forecasts
- CLIMATE
Climate Indicators
- NEWS
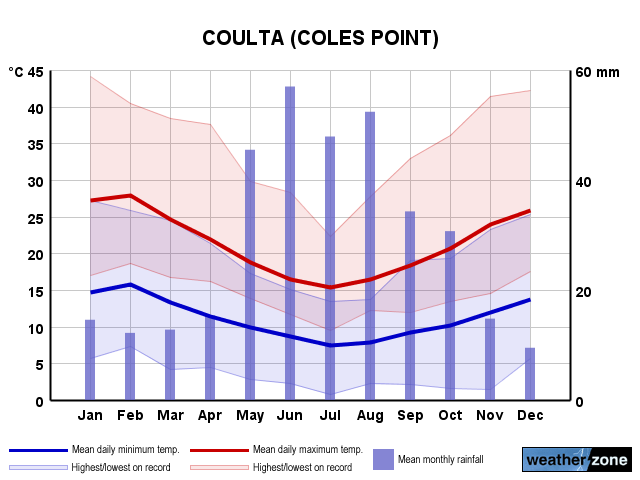
Coles Pt Long-term Averages
| Jan | Feb | Mar | Apr | May | Jun | Jul | Aug | Sep | Oct | Nov | Dec | Ann | |
|---|---|---|---|---|---|---|---|---|---|---|---|---|---|
| Mean Max (°C) |
27.5 | 27.4 | 25.2 | 22.3 | 18.9 | 16.4 | 15.5 | 16.4 | 18.4 | 21.3 | 24.4 | 25.8 | 21.5 |
| Mean Min (°C) |
15.0 | 15.4 | 13.9 | 11.9 | 9.9 | 8.2 | 7.5 | 7.8 | 8.9 | 10.2 | 12.2 | 13.9 | 11.2 |
| Mean Rain (mm) |
16.8 | 15.2 | 21.9 | 23.8 | 45.0 | 61.6 | 61.2 | 53.2 | 36.7 | 24.5 | 16.0 | 15.8 | 389.1 |
| Median Rain (mm) |
7.2 | 7.0 | 12.6 | 18.8 | 41.4 | 56.2 | 51.0 | 56.7 | 32.8 | 21.8 | 9.4 | 9.6 | 388.4 |
| Mean Rain Days |
4.2 | 3.5 | 6.2 | 8.6 | 14.9 | 17.0 | 19.3 | 18.6 | 14.8 | 9.4 | 5.8 | 5.2 | 124.6 |
Coles Pt Daily Records
| Jan | Feb | Mar | Apr | May | Jun | Jul | Aug | Sep | Oct | Nov | Dec | Ann | |
|---|---|---|---|---|---|---|---|---|---|---|---|---|---|
| High Max (°C) |
46.6 | 43.6 | 40.6 | 37.6 | 32.2 | 28.3 | 23.1 | 29.1 | 33.0 | 36.1 | 42.6 | 42.2 | 46.6 |
| Low Max (°C) |
17.0 | 16.9 | 16.7 | 15.4 | 13.8 | 11.7 | 9.5 | 11.1 | 11.2 | 12.9 | 14.5 | 14.7 | 9.5 |
| High Min (°C) |
27.2 | 26.3 | 24.5 | 21.4 | 17.3 | 15.8 | 14.4 | 13.7 | 19.0 | 19.3 | 23.2 | 25.3 | 27.2 |
| Low Min (°C) |
5.6 | 7.3 | 4.1 | 4.5 | 0.0 | -2.4 | 0.7 | -1.2 | 0.6 | 1.5 | 1.5 | 5.4 | -2.4 |
| High Rain (mm) |
52.2 | 44.0 | 53.6 | 22.8 | 23.0 | 36.4 | 34.4 | 24.2 | 26.0 | 36.0 | 26.8 | 17.2 | 53.6 |
Coles Pt Monthly Records
| Jan | Feb | Mar | Apr | May | Jun | Jul | Aug | Sep | Oct | Nov | Dec | Ann | |
|---|---|---|---|---|---|---|---|---|---|---|---|---|---|
| High Mn. Max (°C) |
31.9 | 30.9 | 28.9 | 24.9 | 21.0 | 17.8 | 16.7 | 18.1 | 20.7 | 24.6 | 28.2 | 29.3 | 23.0 |
| Low Mn. Max (°C) |
24.0 | 24.3 | 22.1 | 19.8 | 17.3 | 14.8 | 13.8 | 14.6 | 15.3 | 18.6 | 21.4 | 23.2 | 20.0 |
| High Mn. Min (°C) |
17.2 | 18.8 | 16.6 | 13.5 | 11.5 | 11.4 | 9.1 | 9.7 | 11.3 | 11.3 | 15.7 | 15.5 | 11.9 |
| Low Mn. Min (°C) |
11.6 | 12.8 | 11.8 | 10.3 | 8.0 | 4.8 | 5.3 | 6.5 | 7.5 | 8.8 | 10.0 | 12.4 | 10.4 |
| High Rain (mm) |
56.8 | 67.8 | 60.0 | 58.4 | 85.0 | 147.4 | 102.0 | 93.2 | 78.6 | 60.2 | 35.4 | 38.0 | 556.6 |
| Low Rain (mm) |
0.6 | 0.0 | 2.0 | 2.8 | 8.4 | 0.0 | 29.2 | 0.4 | 7.4 | 0.6 | 3.8 | 0.6 | 194.0 |
Coles Pt Annual Temperatures & Rainfall
Coles Pt Average Number of Days With Temperatures
| Jan | Feb | Mar | Apr | May | Jun | Jul | Aug | Sep | Oct | Nov | Dec | Ann | |
|---|---|---|---|---|---|---|---|---|---|---|---|---|---|
| ≥ 40°C |
0.6 | 0.3 | 0.0 | 0.0 | 0.0 | 0.0 | 0.0 | 0.0 | 0.0 | 0.0 | 0.1 | 0.0 | 1.1 |
| ≥ 35°C |
4.3 | 3.0 | 1.3 | 0.2 | 0.0 | 0.0 | 0.0 | 0.0 | 0.0 | 0.2 | 1.1 | 2.5 | 12.0 |
| ≥ 30°C |
8.3 | 7.6 | 5.2 | 1.4 | 0.1 | 0.0 | 0.0 | 0.0 | 0.3 | 2.3 | 5.6 | 7.1 | 36.2 |
| ≤ 2°C |
0.0 | 0.0 | 0.0 | 0.0 | 0.2 | 0.7 | 0.4 | 0.3 | 0.2 | 0.1 | 0.0 | 0.0 | 1.9 |
| ≤ 0°C |
0.0 | 0.0 | 0.0 | 0.0 | 0.0 | 0.2 | 0.0 | 0.0 | 0.0 | 0.0 | 0.0 | 0.0 | 0.2 |
Coles Pt 'per Week' Values (14th/86th Percentiles)
| Jan | Feb | Mar | Apr | May | Jun | Jul | Aug | Sep | Oct | Nov | Dec | Ann | |
|---|---|---|---|---|---|---|---|---|---|---|---|---|---|
| High Max |
34.7 | 34.0 | 31.5 | 26.6 | 21.5 | 18.0 | 17.2 | 18.9 | 22.7 | 26.7 | 31.4 | 32.7 | 28.1 |
| Low Max |
21.9 | 22.1 | 20.6 | 18.6 | 16.3 | 14.7 | 13.7 | 14.0 | 14.9 | 16.6 | 18.7 | 20.3 | 15.6 |
| High Min |
18.8 | 19.6 | 17.6 | 15.2 | 13.2 | 11.8 | 10.8 | 10.8 | 11.7 | 13.4 | 16.3 | 17.4 | 15.6 |
| Low Min |
10.6 | 11.3 | 10.0 | 8.4 | 6.6 | 5.0 | 4.5 | 4.9 | 5.6 | 6.4 | 8.2 | 9.6 | 6.6 |
Coles Pt Data Availability
| Jan | Feb | Mar | Apr | May | Jun | Jul | Aug | Sep | Oct | Nov | Dec | Ann | |
|---|---|---|---|---|---|---|---|---|---|---|---|---|---|
| Years of Minima |
23 | 26 | 25 | 25 | 24 | 23 | 23 | 24 | 24 | 22 | 24 | 22 | 24.0 |
| Earliest Entry |
1992 | 1992 | 1991 | 1991 | 1991 | 1991 | 1991 | 1991 | 1991 | 1991 | 1991 | 1991 | 1991 |
| Latest Entry |
2017 | 2017 | 2017 | 2017 | 2017 | 2016 | 2016 | 2016 | 2016 | 2016 | 2016 | 2016 | 2017 |
| Years of Maxima |
24 | 26 | 25 | 25 | 24 | 20 | 22 | 24 | 24 | 22 | 23 | 22 | 23.0 |
| Earliest Entry |
1992 | 1992 | 1991 | 1991 | 1991 | 1991 | 1991 | 1991 | 1991 | 1991 | 1991 | 1991 | 1991 |
| Latest Entry |
2017 | 2017 | 2017 | 2017 | 2017 | 2016 | 2016 | 2016 | 2016 | 2016 | 2016 | 2016 | 2017 |
| Years of Rainfall |
20 | 22 | 20 | 20 | 18 | 19 | 19 | 19 | 20 | 20 | 20 | 20 | 19.0 |
| Earliest Entry |
1995 | 1995 | 1995 | 1995 | 1995 | 1994 | 1994 | 1994 | 1994 | 1994 | 1994 | 1994 | 1994 |
| Latest Entry |
2017 | 2017 | 2017 | 2017 | 2017 | 2016 | 2016 | 2016 | 2016 | 2016 | 2016 | 2016 | 2017 |
Station Details
COULTA (COLES POINT)
Lower Eyre Peninsula, South Australia
Lower Eyre Peninsula, South Australia
34.3749°S 135.3741°E
28m AMSL
Commenced 1991 / Closed 2017
Commenced 1991 / Closed 2017
Enter a postcode or town name for local weather, or text to search the site. » advanced search
Intense Rainfall: Over 100mm in just 3 days over NSW
14:40 AEST The advance of a trough across the north and center of the state spread clouds across the state and, together with humid onshore winds, intensified instability in eastern NSW, leading to intense rainfall.