- WEATHER
Australia
- National
- New South Wales
- Victoria
- Queensland
- Western Australia
- South Australia
- Tasmania
- ACT
- Northern Territory
Long Range Forecasts
- WARNINGS
- RADAR
- SATELLITE
- MAPS & CHARTS
- LONG RANGE
Long Range Forecasts
- CLIMATE
Climate Indicators
- NEWS
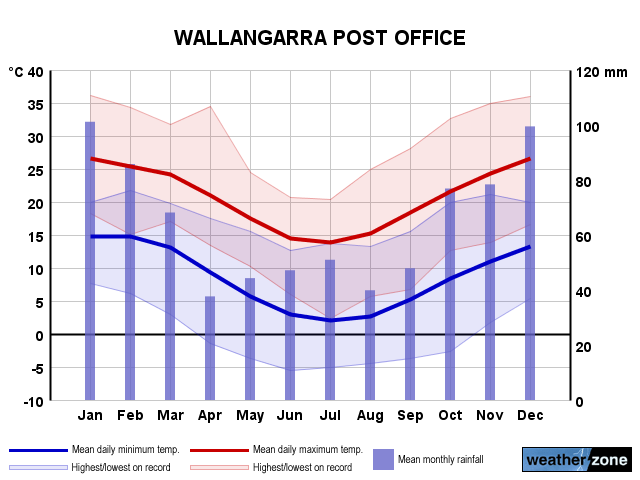
Wallangarra Long-term Averages
| Jan | Feb | Mar | Apr | May | Jun | Jul | Aug | Sep | Oct | Nov | Dec | Ann | |
|---|---|---|---|---|---|---|---|---|---|---|---|---|---|
| Mean Max (°C) |
25.3 | 24.8 | 23.7 | 20.3 | 17.4 | 14.0 | 14.1 | 15.3 | 17.2 | 20.9 | 23.5 | 25.4 | 20.0 |
| Mean Min (°C) |
14.9 | 14.8 | 12.2 | 8.9 | 5.7 | 2.9 | 1.8 | 3.5 | 5.4 | 9.1 | 11.2 | 13.4 | 8.4 |
| Mean Rain (mm) |
98.2 | 82.3 | 70.1 | 37.2 | 43.9 | 45.7 | 48.7 | 40.8 | 47.7 | 74.9 | 79.4 | 100.6 | 770.5 |
| Median Rain (mm) |
79.0 | 61.0 | 45.8 | 28.4 | 31.2 | 33.6 | 41.6 | 31.0 | 39.1 | 62.3 | 70.4 | 93.0 | 711.8 |
| Mean Rain Days |
8.4 | 7.9 | 7.3 | 5.1 | 6.0 | 6.2 | 6.3 | 5.7 | 5.8 | 7.1 | 7.7 | 8.5 | 82.2 |
Wallangarra Daily Records
| Jan | Feb | Mar | Apr | May | Jun | Jul | Aug | Sep | Oct | Nov | Dec | Ann | |
|---|---|---|---|---|---|---|---|---|---|---|---|---|---|
| High Max (°C) |
36.2 | 34.3 | 31.7 | 34.5 | 24.5 | 20.7 | 21.4 | 24.9 | 28.1 | 32.6 | 35.0 | 36.0 | 36.2 |
| Low Max (°C) |
18.3 | 15.1 | 17.0 | 13.4 | 10.2 | 6.0 | 2.4 | 5.7 | 6.5 | 12.7 | 11.3 | 13.3 | 2.4 |
| High Min (°C) |
20.0 | 21.8 | 19.8 | 17.5 | 15.5 | 12.7 | 13.7 | 13.2 | 15.6 | 20.0 | 21.2 | 20.0 | 21.8 |
| Low Min (°C) |
7.7 | 6.1 | 3.0 | -1.5 | -6.4 | -5.6 | -5.1 | -4.5 | -3.7 | -2.7 | 1.7 | 4.4 | -6.4 |
| High Rain (mm) |
154.0 | 148.0 | 118.6 | 112.0 | 103.4 | 125.7 | 128.3 | 60.7 | 90.2 | 109.6 | 73.7 | 121.4 | 154.0 |
Wallangarra Monthly Records
| Jan | Feb | Mar | Apr | May | Jun | Jul | Aug | Sep | Oct | Nov | Dec | Ann | |
|---|---|---|---|---|---|---|---|---|---|---|---|---|---|
| High Mn. Max (°C) |
27.1 | 25.8 | 25.5 | 20.5 | 19.7 | 15.1 | 15.6 | 16.4 | 19.0 | 22.4 | 27.6 | 27.1 | 20.7 |
| Low Mn. Max (°C) |
23.6 | 22.3 | 22.1 | 20.2 | 16.4 | 13.3 | 13.3 | 14.6 | 14.8 | 19.6 | 22.5 | 24.7 | 19.5 |
| High Mn. Min (°C) |
16.5 | 16.2 | 13.0 | 9.9 | 7.4 | 4.1 | 5.8 | 4.8 | 6.9 | 10.2 | 12.2 | 14.7 | 9.6 |
| Low Mn. Min (°C) |
13.5 | 13.6 | 11.2 | 7.9 | 2.9 | 1.7 | -0.8 | 0.9 | 3.1 | 8.6 | 9.3 | 12.0 | 7.9 |
| High Rain (mm) |
266.0 | 297.7 | 311.4 | 160.1 | 182.8 | 247.9 | 191.6 | 130.7 | 223.6 | 320.2 | 248.2 | 263.9 | 1150.5 |
| Low Rain (mm) |
6.8 | 0.0 | 0.0 | 0.0 | 0.0 | 0.0 | 0.0 | 0.6 | 0.0 | 6.9 | 0.0 | 15.3 | 267.2 |
Wallangarra Annual Temperatures & Rainfall
Wallangarra Average Number of Days With Temperatures
| Jan | Feb | Mar | Apr | May | Jun | Jul | Aug | Sep | Oct | Nov | Dec | Ann | |
|---|---|---|---|---|---|---|---|---|---|---|---|---|---|
| ≥ 40°C |
0.0 | 0.0 | 0.0 | 0.0 | 0.0 | 0.0 | 0.0 | 0.0 | 0.0 | 0.0 | 0.0 | 0.0 | 0.0 |
| ≥ 35°C |
0.0 | 0.0 | 0.0 | 0.0 | 0.0 | 0.0 | 0.0 | 0.0 | 0.0 | 0.0 | 0.3 | 0.0 | 0.0 |
| ≥ 30°C |
2.4 | 1.3 | 1.2 | 0.0 | 0.0 | 0.0 | 0.0 | 0.0 | 0.0 | 0.0 | 1.0 | 2.4 | 7.0 |
| ≤ 2°C |
0.0 | 0.0 | 0.0 | 1.0 | 5.8 | 11.5 | 16.0 | 10.2 | 5.2 | 0.5 | 0.0 | 0.0 | 48.2 |
| ≤ 0°C |
0.0 | 0.0 | 0.0 | 0.0 | 1.6 | 5.2 | 11.4 | 5.0 | 2.0 | 0.0 | 0.0 | 0.0 | 24.2 |
Wallangarra 'per Week' Values (14th/86th Percentiles)
| Jan | Feb | Mar | Apr | May | Jun | Jul | Aug | Sep | Oct | Nov | Dec | Ann | |
|---|---|---|---|---|---|---|---|---|---|---|---|---|---|
| High Max |
30.6 | 29.5 | 27.5 | 24.4 | 20.3 | 17.2 | 16.5 | 18.3 | 22.5 | 25.8 | 28.2 | 30.2 | 27.0 |
| Low Max |
23.0 | 22.0 | 21.1 | 18.3 | 14.9 | 11.8 | 10.5 | 12.4 | 14.1 | 17.5 | 19.5 | 22.0 | 14.3 |
| High Min |
17.3 | 17.2 | 15.5 | 13.3 | 10.7 | 7.5 | 7.0 | 7.2 | 9.6 | 12.2 | 14.6 | 16.2 | 14.8 |
| Low Min |
12.2 | 12.0 | 10.2 | 5.5 | 2.0 | -0.6 | -2.5 | -1.0 | 1.4 | 4.5 | 7.4 | 10.0 | 1.6 |
Wallangarra Data Availability
| Jan | Feb | Mar | Apr | May | Jun | Jul | Aug | Sep | Oct | Nov | Dec | Ann | |
|---|---|---|---|---|---|---|---|---|---|---|---|---|---|
| Years of Minima |
6 | 5 | 3 | 2 | 5 | 4 | 5 | 5 | 5 | 6 | 7 | 6 | 5.0 |
| Earliest Entry |
1969 | 1969 | 1969 | 1969 | 1969 | 1969 | 1969 | 1969 | 1969 | 1969 | 1968 | 1968 | 1968 |
| Latest Entry |
1992 | 1992 | 1992 | 1992 | 1992 | 1992 | 1991 | 1991 | 1991 | 1991 | 1991 | 1991 | 1992 |
| Years of Maxima |
5 | 6 | 5 | 2 | 5 | 5 | 6 | 6 | 5 | 6 | 7 | 5 | 5.0 |
| Earliest Entry |
1969 | 1969 | 1969 | 1969 | 1969 | 1969 | 1969 | 1969 | 1969 | 1969 | 1968 | 1968 | 1968 |
| Latest Entry |
1992 | 1992 | 1992 | 1992 | 1992 | 1992 | 1991 | 1991 | 1991 | 1991 | 1991 | 1991 | 1992 |
| Years of Rainfall |
128 | 131 | 126 | 130 | 133 | 133 | 131 | 132 | 134 | 127 | 131 | 121 | 132.0 |
| Earliest Entry |
1889 | 1889 | 1889 | 1888 | 1888 | 1888 | 1888 | 1888 | 1888 | 1888 | 1888 | 1888 | 1888 |
| Latest Entry |
2024 | 2024 | 2023 | 2023 | 2023 | 2023 | 2023 | 2023 | 2023 | 2023 | 2023 | 2023 | 2024 |
Station Details
WALLANGARRA POST OFFICE
Darling Downs, Queensland
Darling Downs, Queensland
28.9231°S 151.9306°E
875m AMSL
Commenced 1888
Commenced 1888
Enter a postcode or town name for local weather, or text to search the site. » advanced search
Wet start to the Olympics... will the rain continue?
14:05 AEST The Paris 2024 Summer Olympics opening ceremony was quite the unique spectacle.
- 16:04 AEST Snowy weekend ahead in the mountains
- 13:42 AEST Perth's first wetter-than-average month in more than a year
- 13:13 AEST Prolonged cold outbreak for southeastern Australia
- 14:03 AEST A stormy taste of spring for NSW and Qld