- WEATHER
Australia
- National
- New South Wales
- Victoria
- Queensland
- Western Australia
- South Australia
- Tasmania
- ACT
- Northern Territory
Long Range Forecasts
- WARNINGS
- RADAR
- SATELLITE
- MAPS & CHARTS
- LONG RANGE
Long Range Forecasts
- CLIMATE
Climate Indicators
- NEWS
Broadwater Sugar Mill Long-term Averages
| Jan | Feb | Mar | Apr | May | Jun | Jul | Aug | Sep | Oct | Nov | Dec | Ann | |
|---|---|---|---|---|---|---|---|---|---|---|---|---|---|
| Mean Max (°C) |
28.3 | 27.9 | 27.1 | 25.5 | 22.5 | 20.1 | 19.6 | 20.7 | 22.8 | 25.3 | 27.1 | 28.2 | 24.6 |
| Mean Min (°C) |
19.5 | 19.5 | 18.1 | 15.1 | 11.5 | 9.5 | 7.3 | 8.4 | 10.5 | 14.3 | 16.0 | 17.9 | 14.0 |
| Mean Rain (mm) |
162.8 | 165.0 | 186.6 | 151.1 | 146.3 | 126.1 | 99.4 | 78.3 | 54.2 | 79.7 | 91.0 | 112.4 | 1449.3 |
| Median Rain (mm) |
132.6 | 130.5 | 166.0 | 125.9 | 113.3 | 99.5 | 56.8 | 62.6 | 38.9 | 62.5 | 68.7 | 84.4 | 1348.3 |
| Mean Rain Days |
11.9 | 12.2 | 13.9 | 12.5 | 11.5 | 9.8 | 8.0 | 7.4 | 7.3 | 8.5 | 9.1 | 10.0 | 120.8 |
Broadwater Sugar Mill Daily Records
| Jan | Feb | Mar | Apr | May | Jun | Jul | Aug | Sep | Oct | Nov | Dec | Ann | |
|---|---|---|---|---|---|---|---|---|---|---|---|---|---|
| High Max (°C) |
38.9 | 36.7 | 36.6 | 35.6 | 29.9 | 27.3 | 28.0 | 30.0 | 34.4 | 37.8 | 43.3 | 40.0 | 43.3 |
| Low Max (°C) |
22.2 | 18.9 | 20.0 | 17.8 | 14.4 | 8.3 | 12.8 | 13.3 | 15.0 | 16.1 | 17.2 | 20.0 | 8.3 |
| High Min (°C) |
25.0 | 23.3 | 23.2 | 21.5 | 19.4 | 17.8 | 17.2 | 16.0 | 17.5 | 20.6 | 21.7 | 23.9 | 25.0 |
| Low Min (°C) |
13.8 | 15.0 | 11.7 | 8.9 | 4.4 | 2.2 | 1.1 | 1.9 | 4.4 | 5.0 | 6.7 | 10.6 | 1.1 |
| High Rain (mm) |
218.9 | 320.0 | 434.0 | 213.0 | 239.0 | 152.1 | 184.9 | 162.6 | 72.1 | 252.5 | 123.2 | 181.4 | 434.0 |
Broadwater Sugar Mill Monthly Records
| Jan | Feb | Mar | Apr | May | Jun | Jul | Aug | Sep | Oct | Nov | Dec | Ann | |
|---|---|---|---|---|---|---|---|---|---|---|---|---|---|
| High Mn. Max (°C) |
30.6 | 29.9 | 29.5 | 27.2 | 24.8 | 21.1 | 21.3 | 22.3 | 24.7 | 26.7 | 30.6 | 30.4 | 26.1 |
| Low Mn. Max (°C) |
26.5 | 26.1 | 24.9 | 24.1 | 21.1 | 17.7 | 17.7 | 19.1 | 21.0 | 23.2 | 25.3 | 26.4 | 23.8 |
| High Mn. Min (°C) |
21.2 | 21.3 | 19.2 | 16.2 | 13.0 | 14.3 | 10.5 | 9.8 | 11.7 | 15.8 | 16.9 | 19.7 | 14.9 |
| Low Mn. Min (°C) |
17.7 | 18.3 | 17.0 | 13.7 | 10.2 | 7.2 | 5.4 | 6.7 | 9.4 | 12.7 | 14.8 | 16.7 | 13.3 |
| High Rain (mm) |
593.4 | 672.8 | 841.0 | 461.1 | 503.0 | 531.6 | 463.4 | 358.4 | 187.3 | 595.3 | 377.0 | 348.2 | 2441.5 |
| Low Rain (mm) |
12.9 | 8.5 | 17.5 | 23.2 | 3.1 | 5.3 | 0.0 | 0.5 | 0.0 | 1.0 | 7.7 | 19.5 | 501.5 |
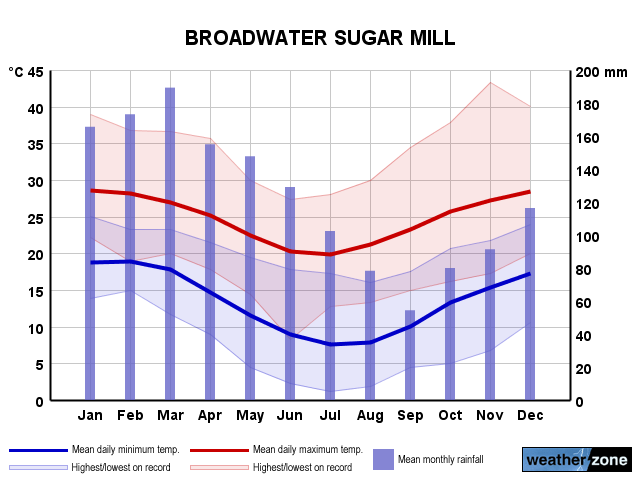
Broadwater Sugar Mill Annual Temperatures & Rainfall
Broadwater Sugar Mill Average Number of Days With Temperatures
| Jan | Feb | Mar | Apr | May | Jun | Jul | Aug | Sep | Oct | Nov | Dec | Ann | |
|---|---|---|---|---|---|---|---|---|---|---|---|---|---|
| ≥ 40°C |
0.0 | 0.0 | 0.0 | 0.0 | 0.0 | 0.0 | 0.0 | 0.0 | 0.0 | 0.0 | 0.3 | 0.1 | 0.4 |
| ≥ 35°C |
1.2 | 0.6 | 0.1 | 0.1 | 0.0 | 0.0 | 0.0 | 0.0 | 0.0 | 0.5 | 1.8 | 1.9 | 5.6 |
| ≥ 30°C |
7.9 | 5.1 | 4.0 | 2.1 | 0.0 | 0.0 | 0.0 | 0.1 | 0.9 | 3.6 | 7.1 | 8.9 | 36.1 |
| ≤ 2°C |
0.0 | 0.0 | 0.0 | 0.0 | 0.0 | 0.0 | 0.5 | 0.1 | 0.0 | 0.0 | 0.0 | 0.0 | 0.5 |
| ≤ 0°C |
0.0 | 0.0 | 0.0 | 0.0 | 0.0 | 0.0 | 0.0 | 0.0 | 0.0 | 0.0 | 0.0 | 0.0 | 0.0 |
Broadwater Sugar Mill 'per Week' Values (14th/86th Percentiles)
| Jan | Feb | Mar | Apr | May | Jun | Jul | Aug | Sep | Oct | Nov | Dec | Ann | |
|---|---|---|---|---|---|---|---|---|---|---|---|---|---|
| High Max |
31.1 | 30.6 | 29.6 | 28.3 | 25.1 | 22.2 | 22.2 | 23.7 | 26.7 | 29.4 | 31.7 | 32.3 | 28.9 |
| Low Max |
25.6 | 25.6 | 24.4 | 22.8 | 20.0 | 17.8 | 17.2 | 17.8 | 19.3 | 21.6 | 23.3 | 24.4 | 19.4 |
| High Min |
21.8 | 21.1 | 20.0 | 17.2 | 15.0 | 12.8 | 10.6 | 11.2 | 13.3 | 17.2 | 19.0 | 20.6 | 19.5 |
| Low Min |
17.2 | 17.2 | 16.1 | 12.8 | 8.3 | 6.1 | 3.9 | 5.4 | 7.8 | 11.1 | 12.8 | 15.0 | 7.8 |
Broadwater Sugar Mill Data Availability
| Jan | Feb | Mar | Apr | May | Jun | Jul | Aug | Sep | Oct | Nov | Dec | Ann | |
|---|---|---|---|---|---|---|---|---|---|---|---|---|---|
| Years of Minima |
10 | 10 | 10 | 10 | 10 | 10 | 10 | 9 | 10 | 10 | 10 | 10 | 9.9 |
| Earliest Entry |
1965 | 1965 | 1965 | 1965 | 1965 | 1965 | 1965 | 1965 | 1965 | 1965 | 1965 | 1965 | 1965 |
| Latest Entry |
1975 | 1975 | 1975 | 1975 | 1975 | 1975 | 1975 | 1975 | 1974 | 1974 | 1974 | 1974 | 1975 |
| Years of Maxima |
10 | 10 | 10 | 10 | 10 | 10 | 10 | 9 | 10 | 10 | 10 | 10 | 9.9 |
| Earliest Entry |
1965 | 1965 | 1965 | 1965 | 1965 | 1965 | 1965 | 1965 | 1965 | 1965 | 1965 | 1965 | 1965 |
| Latest Entry |
1975 | 1975 | 1975 | 1975 | 1975 | 1975 | 1975 | 1975 | 1974 | 1974 | 1974 | 1974 | 1975 |
| Years of Rainfall |
58 | 59 | 59 | 60 | 61 | 61 | 61 | 61 | 60 | 60 | 60 | 60 | 59.9 |
| Earliest Entry |
1917 | 1916 | 1916 | 1915 | 1915 | 1915 | 1915 | 1915 | 1915 | 1915 | 1915 | 1915 | 1915 |
| Latest Entry |
1975 | 1975 | 1975 | 1975 | 1975 | 1975 | 1975 | 1975 | 1974 | 1974 | 1974 | 1974 | 1975 |
Station Details
BROADWATER SUGAR MILL
Northern Rivers, New South Wales/ACT
Northern Rivers, New South Wales/ACT
29.0167°S 153.4333°E
6m AMSL
Commenced 1915 / Closed 1975
Commenced 1915 / Closed 1975
Enter a postcode or town name for local weather, or text to search the site. » advanced search
Signs indicating Australia's cool season arrival
16:15 AEST Mere hours after our Total Lightning Network went quiet over the Australian continent, the Himawari satellite captured a clear, textbook snapshot of the arrival of Australia's cool season. A few distinguishing features should catch your eye: A band of cloud streaming over northern WA and towards the nation's interior A distinct clearing of cloud from most of the NT's Top End, and A band of cloud crossing to the south of WA Turns out, all three of these features point to one thing: winter is knocking at the door. Image: Himawari satellite imagery and mean sea level pressure (ECMWF) over Australia on the morning of Saturday, April 27th, 2024.