- WEATHER
Australia
- National
- New South Wales
- Victoria
- Queensland
- Western Australia
- South Australia
- Tasmania
- ACT
- Northern Territory
Long Range Forecasts
- WARNINGS
- RADAR
- SATELLITE
- MAPS & CHARTS
- LONG RANGE
Long Range Forecasts
- CLIMATE
Climate Indicators
- NEWS
Goulburn Long-term Averages
| Jan | Feb | Mar | Apr | May | Jun | Jul | Aug | Sep | Oct | Nov | Dec | Ann | |
|---|---|---|---|---|---|---|---|---|---|---|---|---|---|
| Mean Max (°C) |
27.9 | 26.4 | 23.9 | 20.0 | 15.8 | 12.3 | 11.6 | 13.2 | 16.6 | 19.9 | 22.9 | 25.9 | 19.6 |
| Mean Min (°C) |
14.0 | 13.7 | 11.4 | 7.9 | 4.6 | 2.7 | 1.6 | 2.3 | 4.7 | 7.1 | 9.7 | 12.0 | 7.6 |
| Mean Rain (mm) |
65.1 | 62.0 | 61.9 | 45.5 | 41.1 | 53.2 | 39.9 | 54.8 | 47.5 | 52.8 | 67.3 | 61.9 | 645.6 |
| Median Rain (mm) |
55.0 | 48.7 | 46.0 | 26.2 | 36.3 | 36.2 | 41.3 | 40.8 | 46.3 | 50.0 | 66.2 | 46.6 | 627.9 |
| Mean Rain Days |
10.1 | 10.0 | 11.4 | 11.0 | 13.0 | 16.3 | 16.4 | 14.5 | 11.2 | 11.2 | 11.2 | 9.8 | 145.8 |
Goulburn Daily Records
| Jan | Feb | Mar | Apr | May | Jun | Jul | Aug | Sep | Oct | Nov | Dec | Ann | |
|---|---|---|---|---|---|---|---|---|---|---|---|---|---|
| High Max (°C) |
41.7 | 41.2 | 37.2 | 32.6 | 25.0 | 21.0 | 19.0 | 24.0 | 30.3 | 32.7 | 40.1 | 41.4 | 41.7 |
| Low Max (°C) |
13.9 | 13.7 | 12.7 | 8.5 | 5.2 | 3.9 | 4.2 | 4.6 | 7.0 | 8.5 | 9.1 | 12.0 | 3.9 |
| High Min (°C) |
26.2 | 27.5 | 22.0 | 20.1 | 14.9 | 12.4 | 11.4 | 12.5 | 16.6 | 20.0 | 24.4 | 23.5 | 27.5 |
| Low Min (°C) |
3.8 | 3.3 | -0.6 | -4.4 | -5.5 | -7.4 | -8.5 | -6.8 | -6.0 | -2.0 | -0.5 | 0.9 | -8.5 |
| High Rain (mm) |
148.2 | 73.4 | 93.4 | 92.0 | 61.2 | 114.0 | 40.4 | 99.2 | 35.2 | 51.6 | 63.8 | 90.0 | 148.2 |
Goulburn Monthly Records
| Jan | Feb | Mar | Apr | May | Jun | Jul | Aug | Sep | Oct | Nov | Dec | Ann | |
|---|---|---|---|---|---|---|---|---|---|---|---|---|---|
| High Mn. Max (°C) |
32.5 | 30.1 | 27.7 | 24.0 | 18.5 | 14.6 | 13.7 | 16.8 | 20.2 | 23.5 | 28.4 | 30.3 | 21.3 |
| Low Mn. Max (°C) |
22.6 | 22.7 | 21.0 | 17.6 | 13.9 | 10.2 | 9.7 | 10.9 | 13.5 | 16.8 | 18.7 | 21.9 | 17.4 |
| High Mn. Min (°C) |
18.0 | 15.9 | 13.7 | 11.4 | 7.9 | 6.4 | 4.2 | 5.4 | 6.7 | 10.0 | 12.4 | 14.8 | 8.9 |
| Low Mn. Min (°C) |
11.1 | 10.9 | 8.6 | 5.1 | 2.1 | -0.9 | -1.7 | 0.0 | 2.2 | 4.5 | 7.1 | 8.4 | 5.7 |
| High Rain (mm) |
214.0 | 167.0 | 180.8 | 208.2 | 124.6 | 191.2 | 97.2 | 215.0 | 101.6 | 148.4 | 208.0 | 228.4 | 1049.3 |
| Low Rain (mm) |
3.0 | 2.5 | 2.4 | 0.2 | 2.6 | 9.4 | 4.0 | 5.2 | 4.4 | 0.0 | 4.6 | 0.8 | 362.0 |
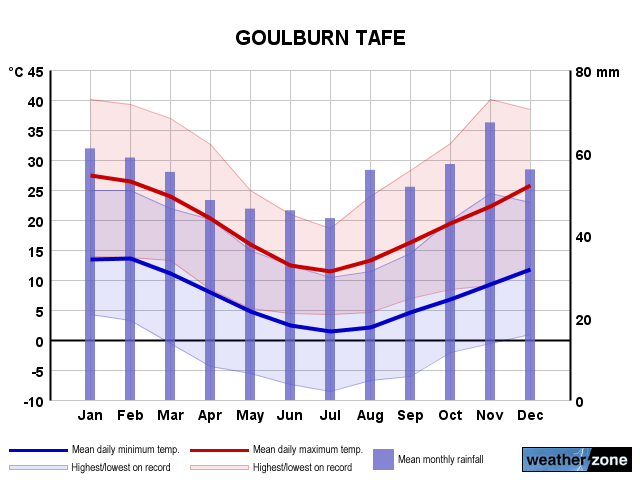
Goulburn Annual Temperatures & Rainfall
Goulburn Average Number of Days With Temperatures
| Jan | Feb | Mar | Apr | May | Jun | Jul | Aug | Sep | Oct | Nov | Dec | Ann | |
|---|---|---|---|---|---|---|---|---|---|---|---|---|---|
| ≥ 40°C |
0.2 | 0.0 | 0.0 | 0.0 | 0.0 | 0.0 | 0.0 | 0.0 | 0.0 | 0.0 | 0.0 | 0.0 | 0.2 |
| ≥ 35°C |
3.6 | 1.7 | 0.2 | 0.0 | 0.0 | 0.0 | 0.0 | 0.0 | 0.0 | 0.0 | 0.4 | 1.1 | 6.7 |
| ≥ 30°C |
11.6 | 6.9 | 3.1 | 0.2 | 0.0 | 0.0 | 0.0 | 0.0 | 0.0 | 0.4 | 2.9 | 7.1 | 31.1 |
| ≤ 2°C |
0.0 | 0.0 | 0.2 | 2.1 | 8.8 | 13.0 | 16.6 | 13.8 | 7.1 | 2.7 | 0.6 | 0.1 | 64.0 |
| ≤ 0°C |
0.0 | 0.0 | 0.0 | 0.7 | 4.1 | 7.8 | 10.5 | 8.7 | 3.1 | 0.8 | 0.0 | 0.0 | 35.2 |
Goulburn 'per Week' Values (14th/86th Percentiles)
| Jan | Feb | Mar | Apr | May | Jun | Jul | Aug | Sep | Oct | Nov | Dec | Ann | |
|---|---|---|---|---|---|---|---|---|---|---|---|---|---|
| High Max |
34.0 | 32.4 | 29.2 | 24.2 | 19.5 | 15.2 | 14.2 | 16.7 | 21.1 | 24.5 | 28.6 | 31.6 | 27.5 |
| Low Max |
21.6 | 20.7 | 19.1 | 16.0 | 12.7 | 9.5 | 8.8 | 9.9 | 12.1 | 14.9 | 16.7 | 20.2 | 11.8 |
| High Min |
16.8 | 16.6 | 14.8 | 11.9 | 9.2 | 6.7 | 5.4 | 6.0 | 8.5 | 11.0 | 13.4 | 15.2 | 13.6 |
| Low Min |
10.0 | 10.3 | 7.1 | 3.5 | 0.2 | -1.9 | -2.5 | -2.0 | 0.5 | 2.6 | 5.2 | 7.9 | 1.0 |
Goulburn Data Availability
| Jan | Feb | Mar | Apr | May | Jun | Jul | Aug | Sep | Oct | Nov | Dec | Ann | |
|---|---|---|---|---|---|---|---|---|---|---|---|---|---|
| Years of Minima |
45 | 46 | 47 | 48 | 48 | 49 | 49 | 49 | 47 | 48 | 49 | 48 | 46.0 |
| Earliest Entry |
1972 | 1972 | 1972 | 1972 | 1972 | 1972 | 1972 | 1972 | 1971 | 1971 | 1971 | 1971 | 1971 |
| Latest Entry |
2024 | 2024 | 2024 | 2024 | 2024 | 2024 | 2024 | 2023 | 2023 | 2023 | 2023 | 2023 | 2024 |
| Years of Maxima |
46 | 47 | 48 | 49 | 49 | 50 | 49 | 49 | 47 | 49 | 48 | 47 | 48.0 |
| Earliest Entry |
1972 | 1972 | 1972 | 1972 | 1972 | 1972 | 1972 | 1972 | 1971 | 1971 | 1971 | 1971 | 1971 |
| Latest Entry |
2024 | 2024 | 2024 | 2024 | 2024 | 2024 | 2024 | 2023 | 2023 | 2023 | 2023 | 2023 | 2024 |
| Years of Rainfall |
49 | 49 | 49 | 49 | 49 | 50 | 49 | 49 | 49 | 50 | 50 | 50 | 48.0 |
| Earliest Entry |
1972 | 1972 | 1972 | 1972 | 1972 | 1972 | 1972 | 1972 | 1971 | 1971 | 1971 | 1971 | 1971 |
| Latest Entry |
2024 | 2024 | 2024 | 2024 | 2024 | 2024 | 2024 | 2023 | 2023 | 2023 | 2023 | 2023 | 2024 |
Station Details
GOULBURN TAFE
Southern Tablelands, New South Wales/ACT
Southern Tablelands, New South Wales/ACT
34.7495°S 149.7034°E
670m AMSL
Commenced 1971
Commenced 1971
Enter a postcode or town name for local weather, or text to search the site. » advanced search
Snowy weekend ahead in the mountains
16:04 AEST Snowfalls last weekend were the heaviest of the 2024 winter in the alpine regions of Tasmania and mainland Australia, and more snow is coming this weekend.