- WEATHER
Australia
- National
- New South Wales
- Victoria
- Queensland
- Western Australia
- South Australia
- Tasmania
- ACT
- Northern Territory
Long Range Forecasts
- WARNINGS
- RADAR
- SATELLITE
- MAPS & CHARTS
- LONG RANGE
Long Range Forecasts
- CLIMATE
Climate Indicators
- NEWS
Benalla Long-term Averages
| Jan | Feb | Mar | Apr | May | Jun | Jul | Aug | Sep | Oct | Nov | Dec | Ann | |
|---|---|---|---|---|---|---|---|---|---|---|---|---|---|
| Mean Max (°C) |
30.8 | 30.5 | 27.2 | 22.2 | 17.4 | 14.1 | 12.9 | 14.6 | 17.4 | 21.0 | 25.0 | 28.3 | 21.8 |
| Mean Min (°C) |
14.7 | 14.8 | 12.0 | 8.4 | 5.7 | 3.5 | 2.9 | 3.9 | 5.4 | 7.6 | 10.2 | 12.6 | 8.5 |
| Mean Rain (mm) |
40.5 | 35.7 | 43.6 | 49.1 | 62.2 | 73.6 | 72.5 | 70.8 | 62.8 | 64.6 | 47.9 | 42.5 | 665.4 |
| Median Rain (mm) |
29.1 | 23.2 | 33.1 | 38.7 | 57.7 | 69.8 | 67.2 | 64.4 | 54.8 | 62.5 | 37.6 | 32.3 | 657.0 |
| Mean Rain Days |
4.7 | 4.0 | 5.2 | 6.3 | 9.3 | 11.5 | 12.9 | 12.7 | 10.5 | 9.3 | 6.6 | 5.5 | 97.6 |
Benalla Daily Records
| Jan | Feb | Mar | Apr | May | Jun | Jul | Aug | Sep | Oct | Nov | Dec | Ann | |
|---|---|---|---|---|---|---|---|---|---|---|---|---|---|
| High Max (°C) |
43.5 | 42.4 | 39.4 | 35.0 | 27.2 | 23.3 | 22.8 | 25.7 | 30.5 | 35.2 | 40.5 | 41.8 | 43.5 |
| Low Max (°C) |
17.2 | 12.5 | 13.6 | 10.6 | 8.3 | 7.0 | 4.4 | 7.7 | 7.8 | 10.6 | 12.7 | 15.0 | 4.4 |
| High Min (°C) |
27.0 | 26.8 | 24.6 | 19.5 | 16.0 | 12.6 | 12.3 | 13.8 | 16.5 | 20.1 | 23.3 | 24.7 | 27.0 |
| Low Min (°C) |
4.0 | 4.8 | 2.8 | -0.5 | -3.4 | -5.0 | -4.2 | -3.6 | -2.5 | -0.8 | 1.3 | 3.2 | -5.0 |
| High Rain (mm) |
78.0 | 78.4 | 102.0 | 90.2 | 77.2 | 51.6 | 62.0 | 49.8 | 67.3 | 177.4 | 73.4 | 82.8 | 177.4 |
Benalla Monthly Records
| Jan | Feb | Mar | Apr | May | Jun | Jul | Aug | Sep | Oct | Nov | Dec | Ann | |
|---|---|---|---|---|---|---|---|---|---|---|---|---|---|
| High Mn. Max (°C) |
35.0 | 34.3 | 30.2 | 25.8 | 20.1 | 17.4 | 15.0 | 18.6 | 20.6 | 24.7 | 29.6 | 31.9 | 23.4 |
| Low Mn. Max (°C) |
27.5 | 26.8 | 24.5 | 19.1 | 13.6 | 12.2 | 11.2 | 12.8 | 14.8 | 17.8 | 21.2 | 24.9 | 20.4 |
| High Mn. Min (°C) |
18.9 | 18.4 | 15.0 | 11.9 | 9.4 | 7.5 | 5.6 | 5.9 | 7.5 | 10.1 | 13.7 | 14.9 | 9.4 |
| Low Mn. Min (°C) |
11.5 | 12.2 | 9.6 | 5.5 | 3.4 | 0.5 | -0.6 | 0.9 | 3.0 | 6.0 | 7.8 | 9.5 | 7.5 |
| High Rain (mm) |
162.9 | 224.5 | 207.8 | 249.7 | 183.9 | 197.1 | 172.4 | 178.3 | 137.8 | 235.0 | 156.2 | 206.3 | 1248.8 |
| Low Rain (mm) |
0.0 | 0.0 | 0.0 | 0.0 | 0.0 | 7.1 | 7.1 | 1.3 | 9.9 | 0.0 | 0.0 | 0.0 | 256.9 |
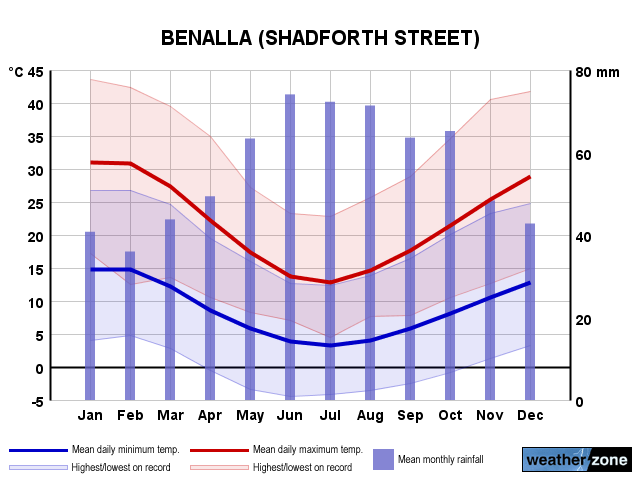
Benalla Annual Temperatures & Rainfall
Benalla Average Number of Days With Temperatures
| Jan | Feb | Mar | Apr | May | Jun | Jul | Aug | Sep | Oct | Nov | Dec | Ann | |
|---|---|---|---|---|---|---|---|---|---|---|---|---|---|
| ≥ 40°C |
0.5 | 0.3 | 0.0 | 0.0 | 0.0 | 0.0 | 0.0 | 0.0 | 0.0 | 0.0 | 0.0 | 0.1 | 0.9 |
| ≥ 35°C |
6.0 | 4.5 | 1.0 | 0.0 | 0.0 | 0.0 | 0.0 | 0.0 | 0.0 | 0.0 | 0.8 | 3.0 | 15.2 |
| ≥ 30°C |
18.4 | 17.0 | 8.2 | 0.5 | 0.0 | 0.0 | 0.0 | 0.0 | 0.0 | 0.7 | 4.8 | 11.8 | 61.1 |
| ≤ 2°C |
0.0 | 0.0 | 0.0 | 0.7 | 5.6 | 10.9 | 12.9 | 9.6 | 5.0 | 1.1 | 0.1 | 0.0 | 45.9 |
| ≤ 0°C |
0.0 | 0.0 | 0.0 | 0.0 | 1.6 | 5.6 | 7.3 | 3.8 | 1.1 | 0.1 | 0.0 | 0.0 | 19.6 |
Benalla 'per Week' Values (14th/86th Percentiles)
| Jan | Feb | Mar | Apr | May | Jun | Jul | Aug | Sep | Oct | Nov | Dec | Ann | |
|---|---|---|---|---|---|---|---|---|---|---|---|---|---|
| High Max |
36.0 | 35.2 | 31.7 | 26.6 | 21.0 | 17.0 | 15.5 | 17.8 | 21.0 | 25.5 | 30.4 | 33.9 | 30.8 |
| Low Max |
25.6 | 25.6 | 22.2 | 17.8 | 13.8 | 11.3 | 10.3 | 11.7 | 14.0 | 17.0 | 19.6 | 22.5 | 13.5 |
| High Min |
19.2 | 18.9 | 16.1 | 12.5 | 10.0 | 7.5 | 6.7 | 7.4 | 9.0 | 11.7 | 14.7 | 17.0 | 15.0 |
| Low Min |
10.5 | 10.6 | 8.0 | 4.5 | 1.5 | -0.6 | -1.0 | 0.4 | 1.7 | 3.8 | 6.1 | 8.3 | 2.3 |
Benalla Data Availability
| Jan | Feb | Mar | Apr | May | Jun | Jul | Aug | Sep | Oct | Nov | Dec | Ann | |
|---|---|---|---|---|---|---|---|---|---|---|---|---|---|
| Years of Minima |
51 | 51 | 51 | 51 | 51 | 51 | 50 | 50 | 50 | 50 | 50 | 50 | 50.4 |
| Earliest Entry |
1957 | 1957 | 1957 | 1957 | 1957 | 1957 | 1957 | 1957 | 1957 | 1957 | 1957 | 1957 | 1957 |
| Latest Entry |
2007 | 2007 | 2007 | 2007 | 2007 | 2007 | 2007 | 2007 | 2007 | 2006 | 2006 | 2006 | 2007 |
| Years of Maxima |
51 | 51 | 51 | 51 | 51 | 51 | 50 | 50 | 50 | 50 | 50 | 50 | 50.4 |
| Earliest Entry |
1957 | 1957 | 1957 | 1957 | 1957 | 1957 | 1957 | 1957 | 1957 | 1957 | 1957 | 1957 | 1957 |
| Latest Entry |
2007 | 2007 | 2007 | 2007 | 2007 | 2007 | 2007 | 2007 | 2007 | 2006 | 2006 | 2006 | 2007 |
| Years of Rainfall |
125 | 125 | 125 | 125 | 125 | 125 | 124 | 124 | 124 | 125 | 125 | 125 | 124.7 |
| Earliest Entry |
1883 | 1883 | 1883 | 1883 | 1883 | 1883 | 1883 | 1883 | 1883 | 1882 | 1882 | 1882 | 1882 |
| Latest Entry |
2007 | 2007 | 2007 | 2007 | 2007 | 2007 | 2007 | 2007 | 2007 | 2006 | 2006 | 2006 | 2007 |
Station Details
BENALLA (SHADFORTH STREET)
North East, Victoria
North East, Victoria
36.5483°S 145.9703°E
170m AMSL
Commenced 1882 / Closed 2006
Commenced 1882 / Closed 2006
Enter a postcode or town name for local weather, or text to search the site. » advanced search
How severe thunderstorms impact energy infrastructure
09:23 AEST Earlier this year destructive thunderstorms and winds equivalent to a category two cyclone lashed Victoria, bending towers and toppling trees and poles. So, how can thunderstorms damage energy infrastructure, and are these events getting worse? This event occurred during mid-February 2024, when a strong cold front generated severe thunderstorms and localised wind gusts of 130km/h after a prolonged period of extreme heat.