- WEATHER
Australia
- National
- New South Wales
- Victoria
- Queensland
- Western Australia
- South Australia
- Tasmania
- ACT
- Northern Territory
Long Range Forecasts
- WARNINGS
- RADAR
- SATELLITE
- MAPS & CHARTS
- LONG RANGE
Long Range Forecasts
- CLIMATE
Climate Indicators
- NEWS
Powranna Long-term Averages
| Jan | Feb | Mar | Apr | May | Jun | Jul | Aug | Sep | Oct | Nov | Dec | Ann | |
|---|---|---|---|---|---|---|---|---|---|---|---|---|---|
| Mean Max (°C) |
24.1 | 24.1 | 22.0 | 17.6 | 14.5 | 11.9 | 11.4 | 12.6 | 14.4 | 17.1 | 19.7 | 22.4 | 17.7 |
| Mean Min (°C) |
10.6 | 10.7 | 8.3 | 6.1 | 4.2 | 2.3 | 2.1 | 2.8 | 4.0 | 5.5 | 6.9 | 8.8 | 6.1 |
| Mean Rain (mm) |
57.9 | 35.5 | 26.8 | 44.8 | 44.0 | 47.7 | 58.1 | 60.7 | 65.6 | 49.9 | 51.6 | 44.5 | 586.5 |
| Median Rain (mm) |
41.0 | 29.5 | 22.9 | 44.9 | 36.0 | 40.8 | 47.5 | 55.4 | 56.7 | 44.2 | 44.0 | 44.4 | 576.9 |
| Mean Rain Days |
7.9 | 6.8 | 6.1 | 9.0 | 12.4 | 13.8 | 17.2 | 14.9 | 14.3 | 12.2 | 10.1 | 7.4 | 126.3 |
Powranna Daily Records
| Jan | Feb | Mar | Apr | May | Jun | Jul | Aug | Sep | Oct | Nov | Dec | Ann | |
|---|---|---|---|---|---|---|---|---|---|---|---|---|---|
| High Max (°C) |
37.0 | 34.6 | 35.5 | 26.5 | 22.0 | 17.8 | 16.2 | 19.0 | 23.0 | 26.8 | 32.0 | 33.5 | 37.0 |
| Low Max (°C) |
13.3 | 14.8 | 13.3 | 10.5 | 8.4 | 5.0 | 4.8 | 7.5 | 8.5 | 10.3 | 10.0 | 13.2 | 4.8 |
| High Min (°C) |
19.5 | 20.0 | 18.0 | 16.2 | 13.2 | 12.5 | 10.3 | 10.7 | 13.3 | 14.0 | 17.2 | 17.5 | 20.0 |
| Low Min (°C) |
0.8 | 1.2 | -1.6 | -3.9 | -5.6 | -6.5 | -5.0 | -4.2 | -3.0 | -3.2 | -1.9 | -1.5 | -6.5 |
| High Rain (mm) |
68.0 | 30.0 | 24.4 | 35.8 | 22.3 | 22.4 | 55.4 | 57.4 | 57.0 | 36.2 | 35.4 | 38.2 | 68.0 |
Powranna Monthly Records
| Jan | Feb | Mar | Apr | May | Jun | Jul | Aug | Sep | Oct | Nov | Dec | Ann | |
|---|---|---|---|---|---|---|---|---|---|---|---|---|---|
| High Mn. Max (°C) |
27.3 | 27.1 | 24.0 | 20.8 | 16.1 | 13.5 | 12.7 | 13.5 | 16.0 | 18.2 | 22.9 | 24.9 | 18.5 |
| Low Mn. Max (°C) |
21.0 | 20.4 | 20.2 | 15.0 | 13.3 | 10.2 | 9.8 | 11.2 | 12.3 | 15.9 | 17.8 | 20.3 | 16.4 |
| High Mn. Min (°C) |
12.3 | 13.3 | 9.6 | 7.5 | 6.6 | 4.1 | 3.9 | 4.2 | 5.5 | 7.6 | 9.9 | 10.3 | 6.7 |
| Low Mn. Min (°C) |
8.2 | 9.1 | 6.9 | 4.6 | 2.4 | 0.1 | 0.4 | 0.6 | 3.0 | 3.8 | 5.1 | 6.3 | 5.3 |
| High Rain (mm) |
160.6 | 94.2 | 58.2 | 88.8 | 93.7 | 115.5 | 139.0 | 156.6 | 119.3 | 129.4 | 101.4 | 84.7 | 756.2 |
| Low Rain (mm) |
1.8 | 6.2 | 3.4 | 14.8 | 8.4 | 6.0 | 30.6 | 22.4 | 16.6 | 13.4 | 19.8 | 10.8 | 415.3 |
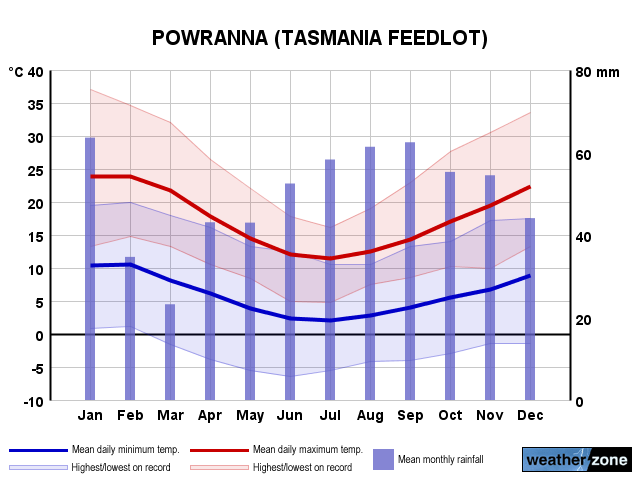
Powranna Annual Temperatures & Rainfall
Powranna Average Number of Days With Temperatures
| Jan | Feb | Mar | Apr | May | Jun | Jul | Aug | Sep | Oct | Nov | Dec | Ann | |
|---|---|---|---|---|---|---|---|---|---|---|---|---|---|
| ≥ 40°C |
0.0 | 0.0 | 0.0 | 0.0 | 0.0 | 0.0 | 0.0 | 0.0 | 0.0 | 0.0 | 0.0 | 0.0 | 0.0 |
| ≥ 35°C |
0.1 | 0.0 | 0.1 | 0.0 | 0.0 | 0.0 | 0.0 | 0.0 | 0.0 | 0.0 | 0.0 | 0.0 | 0.2 |
| ≥ 30°C |
2.7 | 1.7 | 0.6 | 0.0 | 0.0 | 0.0 | 0.0 | 0.0 | 0.0 | 0.0 | 0.2 | 1.0 | 6.0 |
| ≤ 2°C |
0.2 | 0.3 | 1.0 | 4.6 | 9.6 | 13.8 | 15.3 | 12.9 | 7.9 | 5.4 | 2.2 | 0.7 | 68.1 |
| ≤ 0°C |
0.0 | 0.0 | 0.1 | 1.9 | 5.0 | 9.3 | 9.4 | 7.9 | 3.3 | 1.9 | 0.8 | 0.2 | 36.3 |
Powranna 'per Week' Values (14th/86th Percentiles)
| Jan | Feb | Mar | Apr | May | Jun | Jul | Aug | Sep | Oct | Nov | Dec | Ann | |
|---|---|---|---|---|---|---|---|---|---|---|---|---|---|
| High Max |
28.5 | 28.2 | 25.7 | 20.9 | 17.0 | 14.3 | 13.4 | 14.5 | 16.8 | 20.2 | 23.5 | 26.3 | 24.1 |
| Low Max |
20.0 | 19.5 | 18.0 | 14.4 | 12.0 | 9.6 | 9.4 | 10.5 | 12.0 | 14.1 | 16.2 | 18.5 | 11.9 |
| High Min |
14.1 | 14.2 | 12.5 | 10.0 | 9.0 | 6.5 | 6.0 | 6.8 | 7.5 | 9.2 | 10.5 | 12.5 | 11.1 |
| Low Min |
6.7 | 6.8 | 3.9 | 1.6 | -0.4 | -2.1 | -1.5 | -1.3 | 0.3 | 1.4 | 3.0 | 5.0 | 0.8 |
Powranna Data Availability
| Jan | Feb | Mar | Apr | May | Jun | Jul | Aug | Sep | Oct | Nov | Dec | Ann | |
|---|---|---|---|---|---|---|---|---|---|---|---|---|---|
| Years of Minima |
16 | 16 | 16 | 16 | 16 | 16 | 15 | 15 | 15 | 16 | 17 | 16 | 15.9 |
| Earliest Entry |
1992 | 1992 | 1992 | 1992 | 1992 | 1992 | 1992 | 1992 | 1992 | 1991 | 1991 | 1991 | 1991 |
| Latest Entry |
2008 | 2008 | 2008 | 2008 | 2008 | 2008 | 2008 | 2008 | 2008 | 2008 | 2008 | 2008 | 2008 |
| Years of Maxima |
16 | 17 | 16 | 15 | 17 | 16 | 15 | 15 | 15 | 17 | 17 | 16 | 16.0 |
| Earliest Entry |
1992 | 1992 | 1992 | 1992 | 1992 | 1992 | 1992 | 1992 | 1992 | 1991 | 1991 | 1991 | 1991 |
| Latest Entry |
2008 | 2008 | 2008 | 2008 | 2008 | 2008 | 2008 | 2008 | 2008 | 2008 | 2008 | 2008 | 2008 |
| Years of Rainfall |
17 | 17 | 17 | 17 | 17 | 17 | 16 | 16 | 17 | 18 | 18 | 17 | 16.8 |
| Earliest Entry |
1992 | 1992 | 1992 | 1992 | 1992 | 1992 | 1992 | 1992 | 1992 | 1991 | 1991 | 1991 | 1991 |
| Latest Entry |
2008 | 2008 | 2008 | 2008 | 2008 | 2008 | 2008 | 2008 | 2008 | 2008 | 2008 | 2008 | 2008 |
Station Details
POWRANNA (TASMANIA FEEDLOT)
Central North, Tasmania
Central North, Tasmania
41.6839°S 147.2831°E
173m AMSL
Commenced 1991 / Closed 2008
Commenced 1991 / Closed 2008
Enter a postcode or town name for local weather, or text to search the site. » advanced search
Signs indicating Australia's cool season arrival
16:15 AEST Mere hours after our Total Lightning Network went quiet over the Australian continent, the Himawari satellite captured a clear, textbook snapshot of the arrival of Australia's cool season. A few distinguishing features should catch your eye: A band of cloud streaming over northern WA and towards the nation's interior A distinct clearing of cloud from most of the NT's Top End, and A band of cloud crossing to the south of WA Turns out, all three of these features point to one thing: winter is knocking at the door. Image: Himawari satellite imagery and mean sea level pressure (ECMWF) over Australia on the morning of Saturday, April 27th, 2024.